Case Study: Urban Heat Island Vulnerability in Rockford, IL
Remote Sensing Case Study • EAE 554 • December 2023
Project Summary
This case study investigates how the urban heat island (UHI) effect interacts with social and environmental vulnerabilities in Rockford, Illinois. Using Landsat-8 remote sensing data, vegetation indices (NDVI), and CDC/US Census vulnerability metrics, I quantified neighborhood-level UHI intensity and its overlap with social vulnerability (SVI/HVI) and historic redlining. The results show stark disparities in exposure, with certain neighborhoods facing higher heat burdens due to both environmental and socioeconomic factors.
Research Questions
- How severe is the UHI effect in Rockford, IL?
- Which neighborhoods are most impacted by elevated surface temperatures?
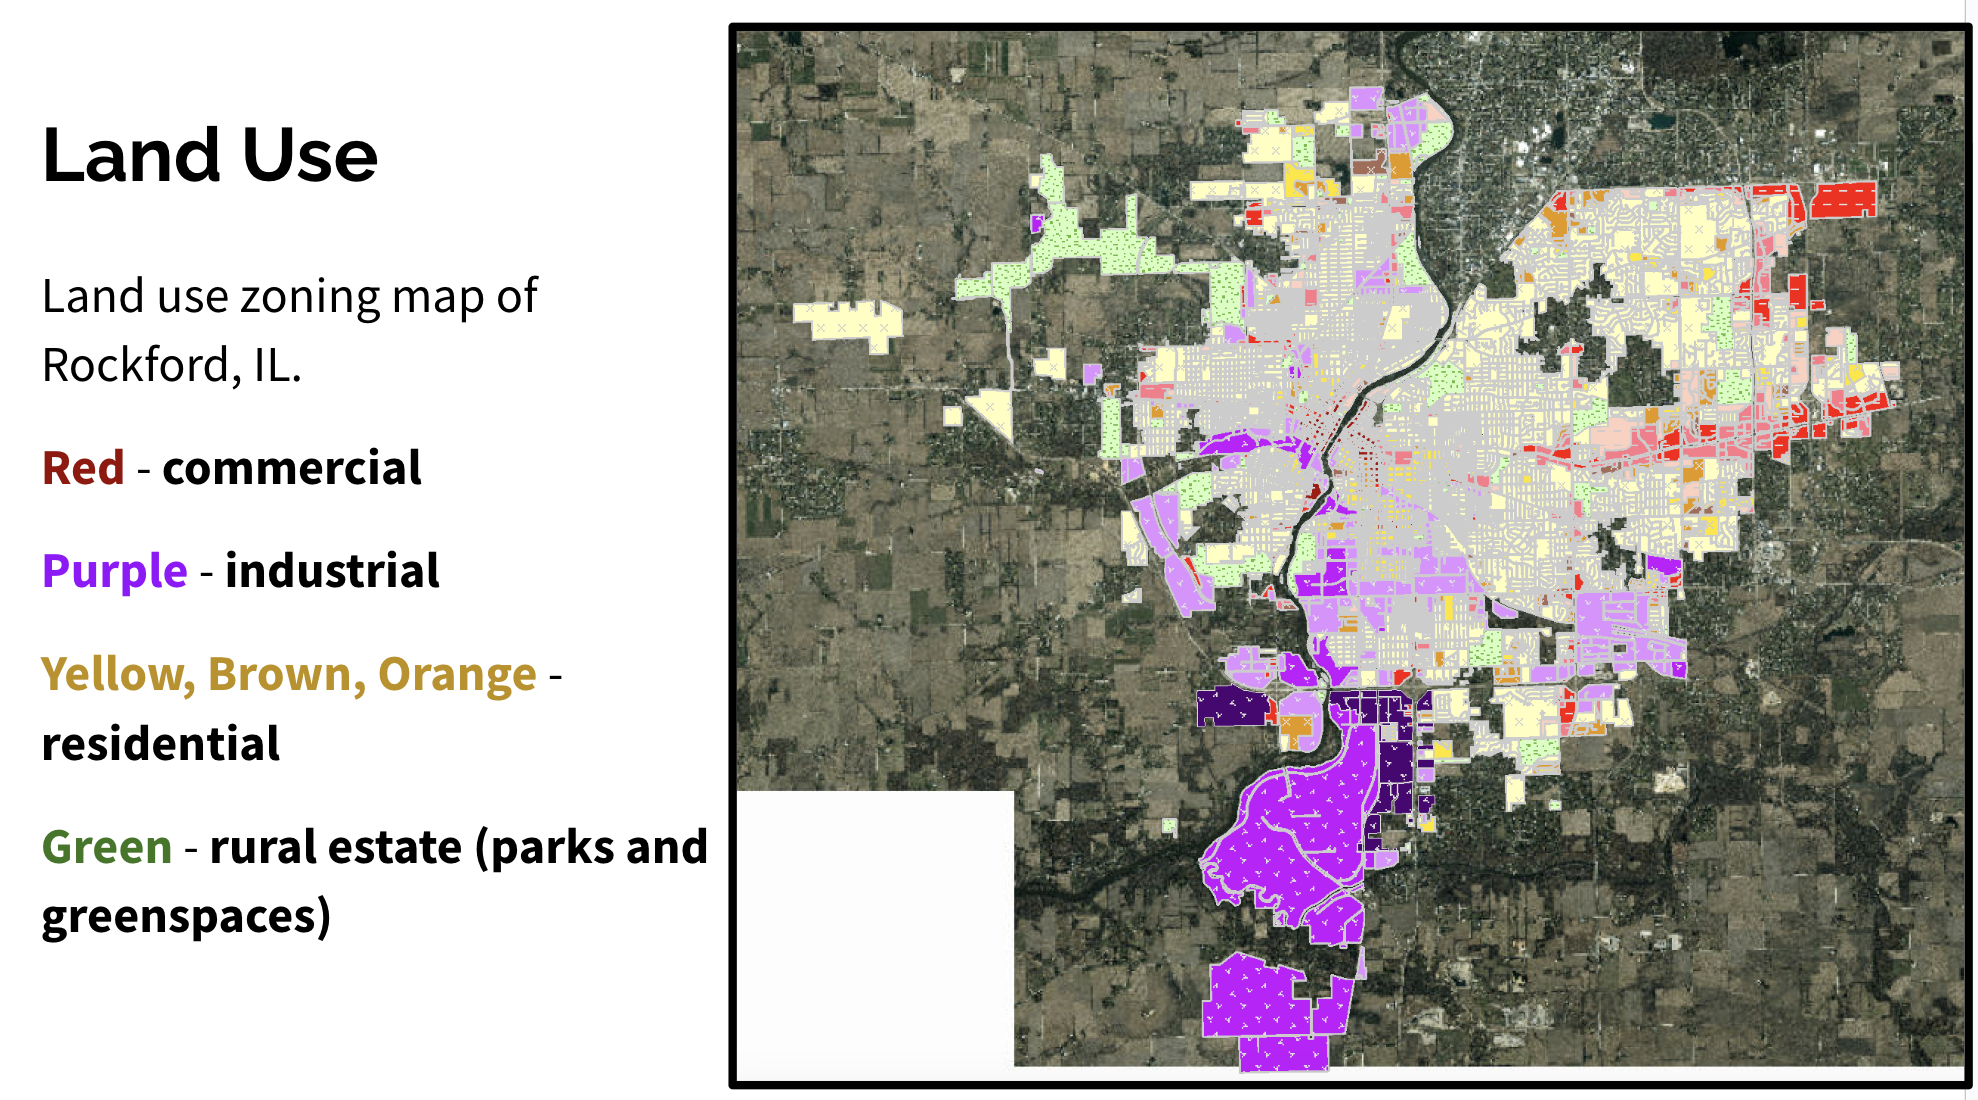
- How do vegetation cover, land use, and historic redlining contribute?
- What mitigation strategies could reduce heat risks for vulnerable communities?
Background
Urban heat islands form when built environments store solar heat more efficiently than vegetated or rural areas. Factors include impervious surfaces, reduced vegetation, anthropogenic waste heat, and local weather/geography. Exposure to extreme heat is a leading weather-related cause of mortality in the U.S., responsible for over 1,300 deaths annually.
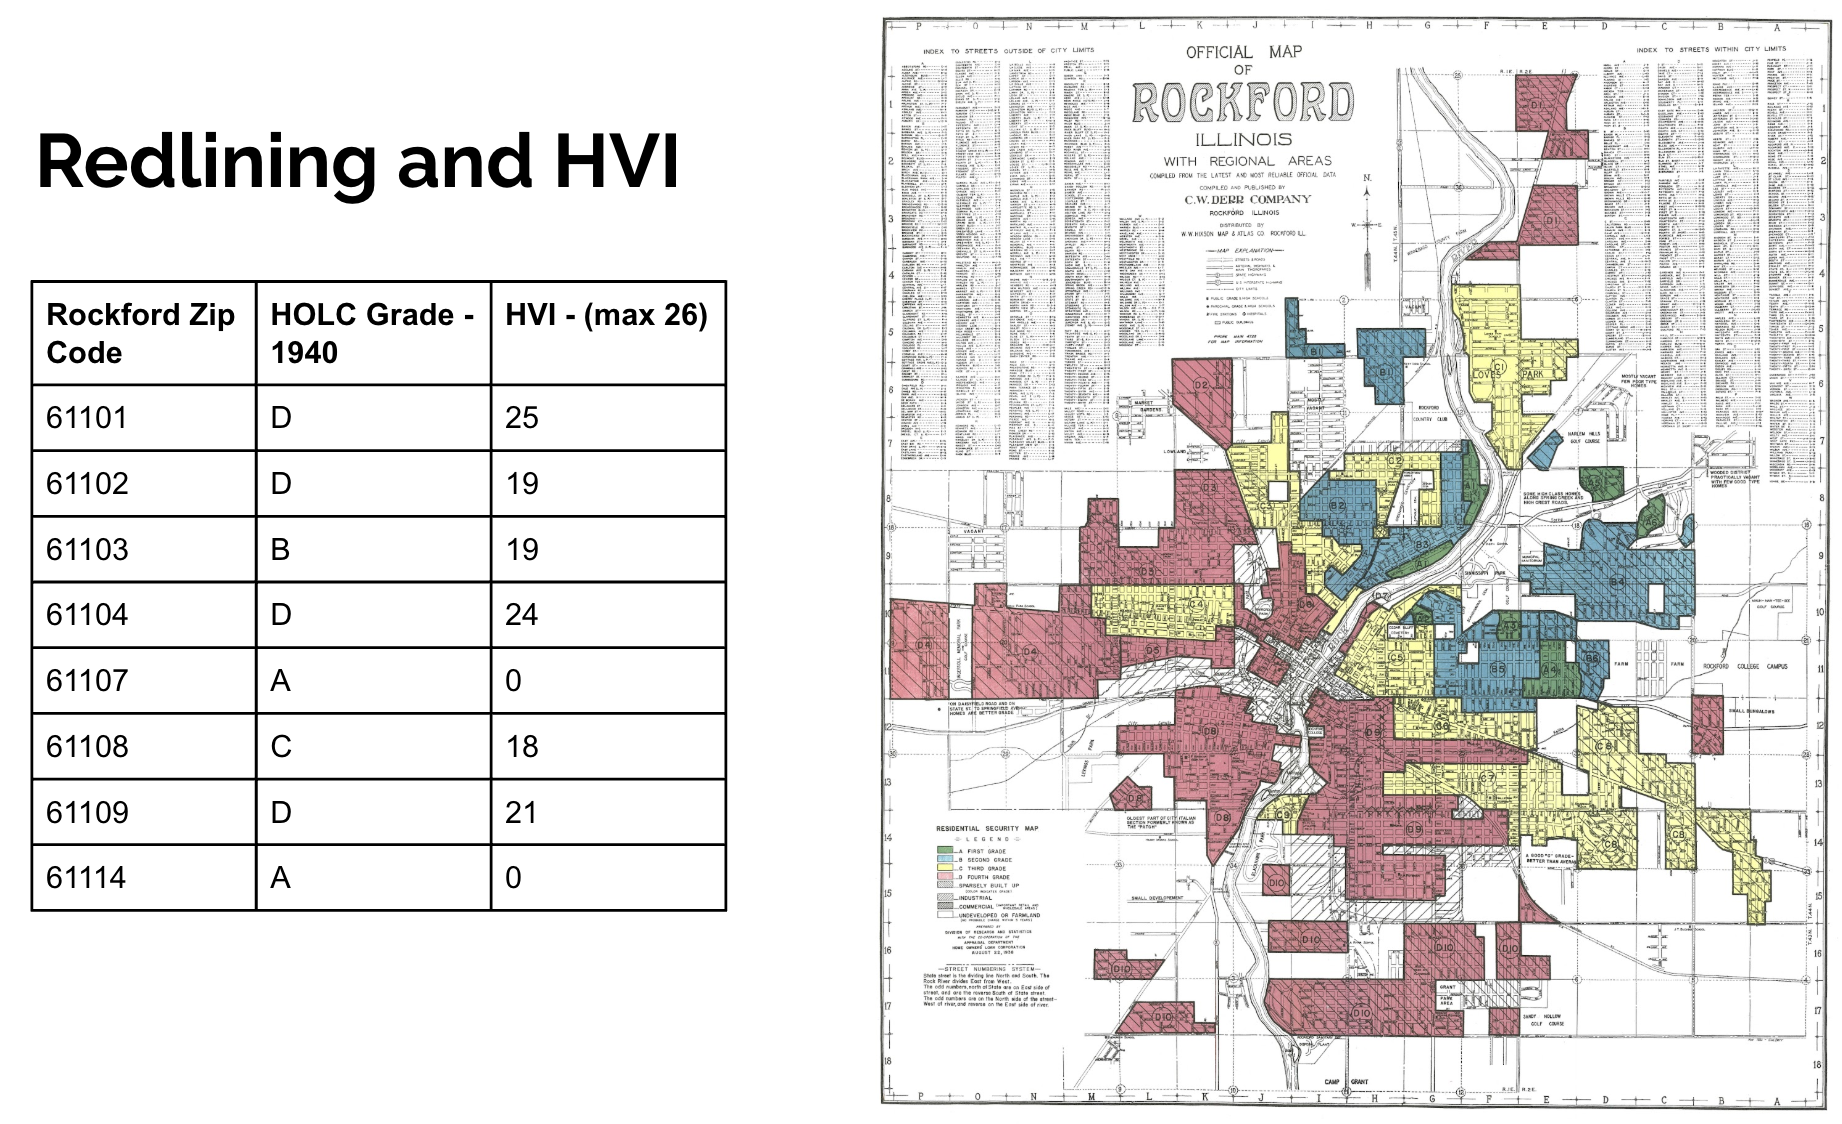
Vulnerability is not evenly distributed. Social Vulnerability Index (SVI) and its heat-focused sub-index (HVI) reveal inequities tied to race, income, housing, and historic practices such as redlining. Rockford’s legacy of redlined neighborhoods makes it an important case for assessing UHI and equity.
Methods & Data
Data Sources: Landsat-8 Collection 2 (Bands 4, 5, 10, QA Pixel), CDC SVI/HVI datasets, HOLC 1940s redlining maps, WinGIS zoning data, U.S. Census Bureau demographics.
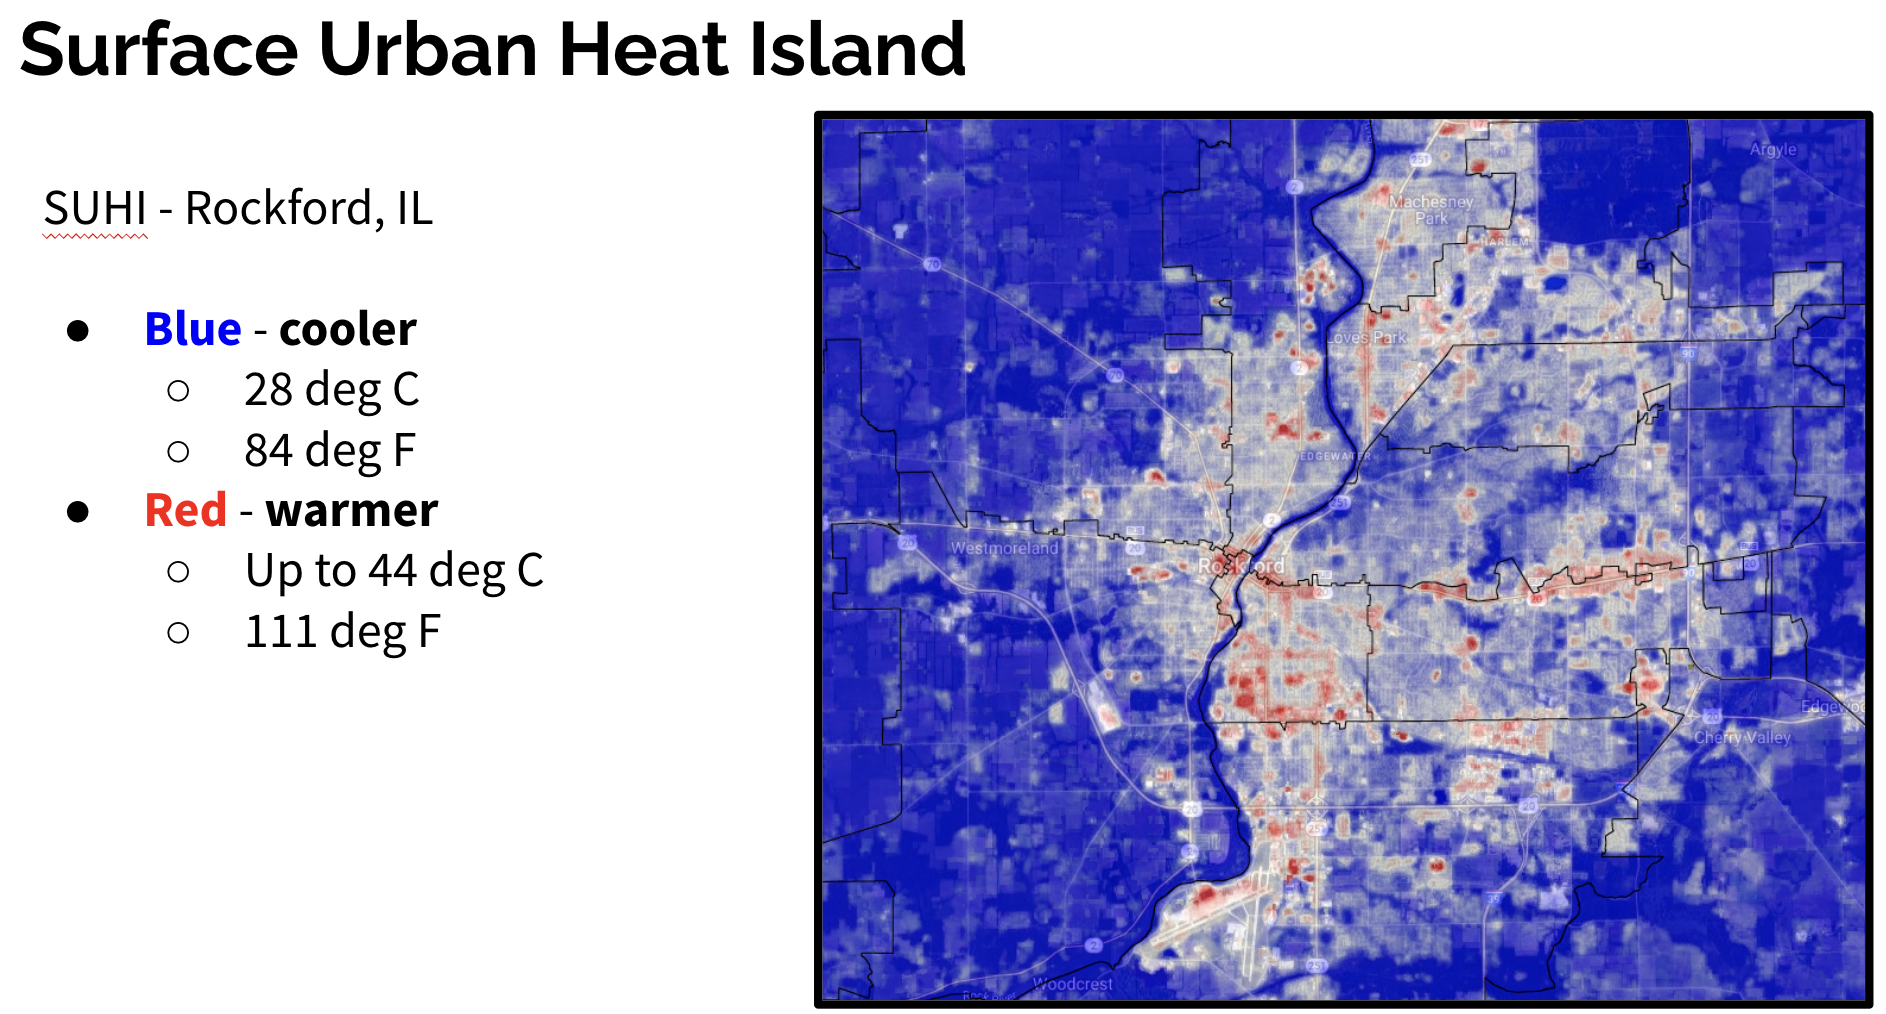
- SUHI: Calculated as \( \text{mean LST}_{\text{urban}} - \text{mean LST}_{\text{rural}} \) (°C).
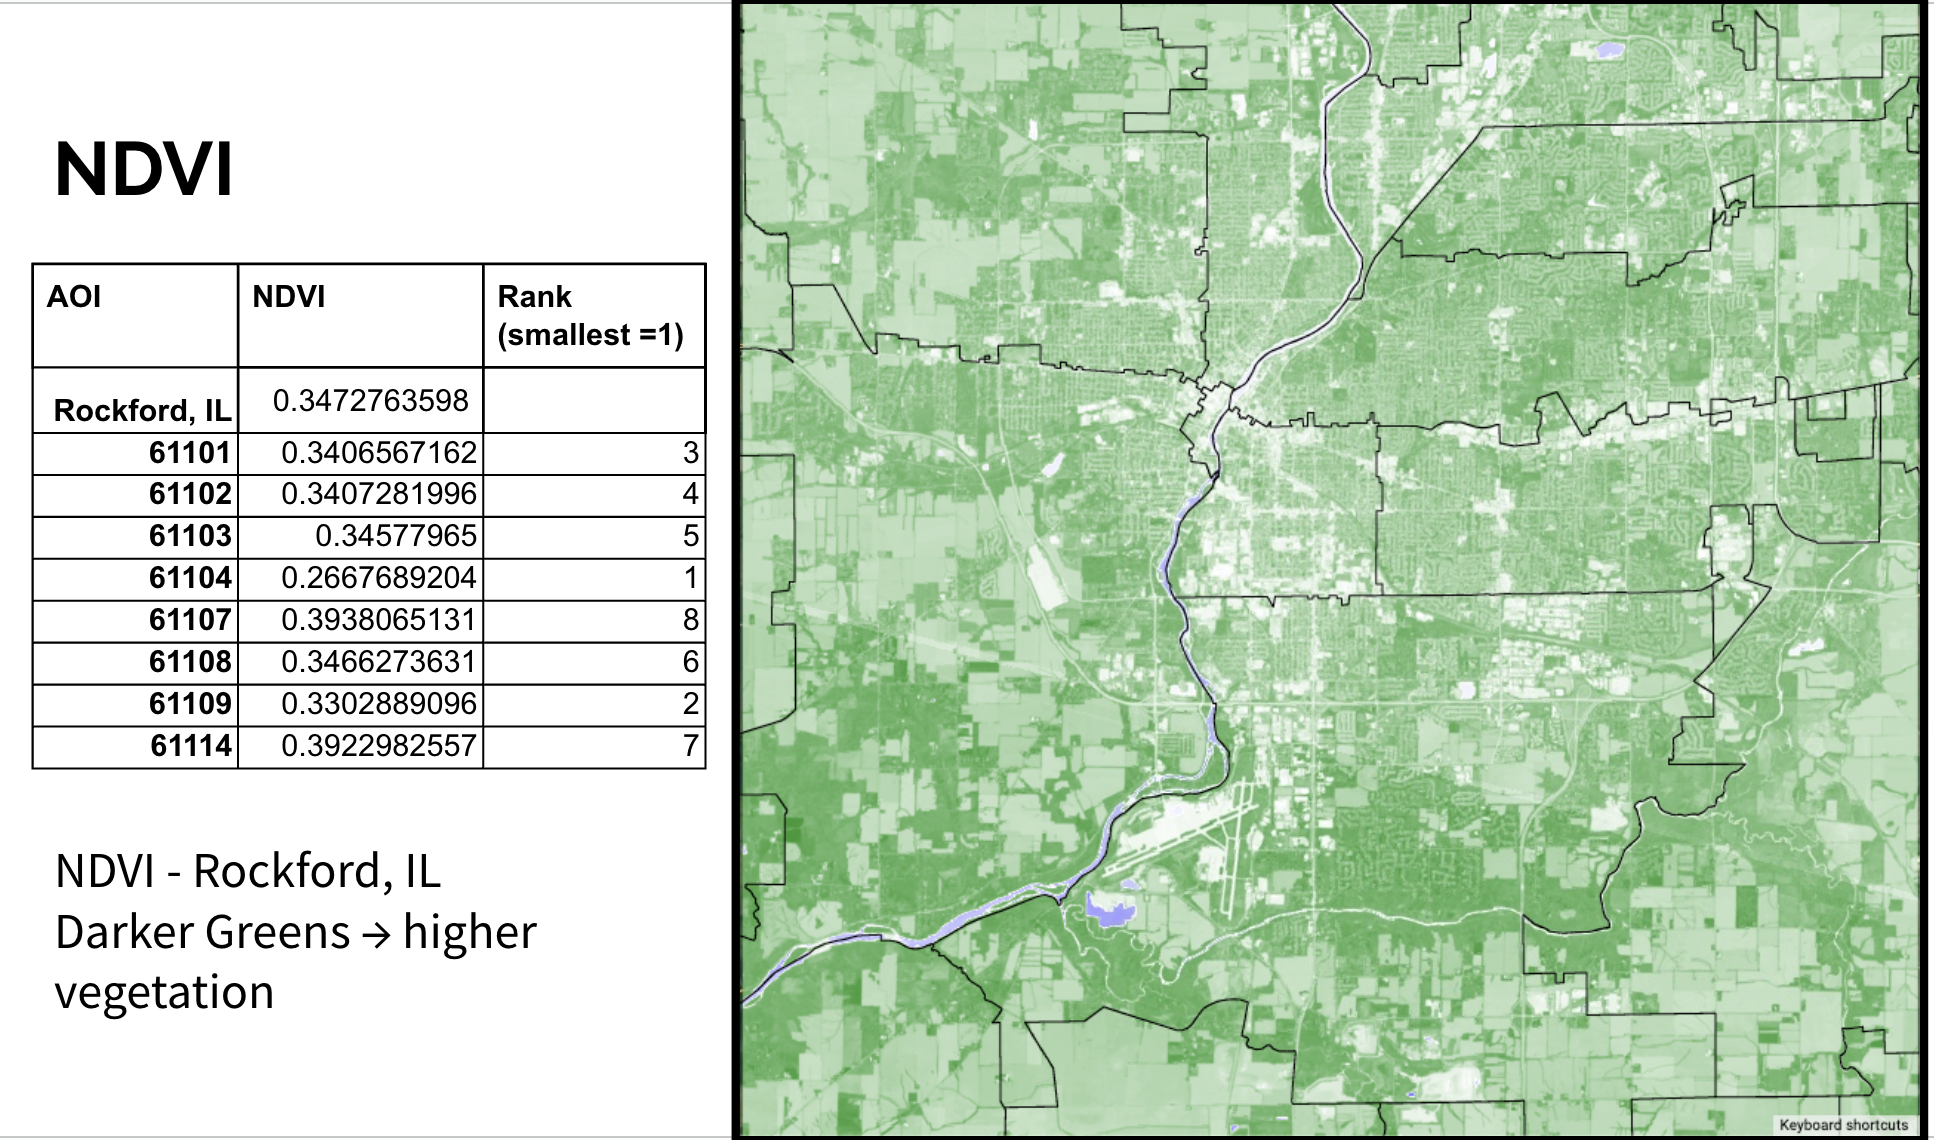
- NDVI: \( NDVI = \frac{NIR - Red}{NIR + Red} \)
- Neighborhood boundaries defined by ZIP codes for consistent socio-demographic analysis.
- Analysis performed in Google Earth Engine (JavaScript) and GIS tools.
Results
Rockford’s average summer SUHI was 6.7°C above rural surroundings. The most impacted neighborhood was ZIP 61104, a historically redlined area, with:
- SUHI of 9.4°C
- HVI score of 24/26
- Lowest NDVI (0.267)
- Land use dominated by industrial/commercial corridors
Mitigation Recommendations
- Expand vegetation: Plant street trees, add shaded medians, reclaim vacant lots as parks, and provide free trees to residents.
- Cooler infrastructure: Incentivize reflective/light roofs and green roofs; improve industrial energy efficiency.
- Community outreach: Extend cooling center hours, partner with schools/libraries, and educate residents on heat safety.