Case Study: Exposure of U.S. Housing to Severe Convective Weather
GIS Term Project • EAE 557 • December 2024
Project Summary
This project investigates how hazardous convective weather (HCW) — tornadoes, damaging wind, and large hail — has impacted U.S. housing across two 20-year climatological periods (1980–2000 and 2001–2021). Using county-level peril reports, housing data, and vulnerability indices, I analyzed spatial changes in HCW exposure and quantified the impacts on both total housing units and mobile/manufactured homes. Results highlight increasing exposure in the Great Plains, Midwest, South, and East Coast, with particular concern for vulnerable populations and mobile home residents.
Research Questions
- How has the spatial climatology of HCW perils changed between 1980–2000 and 2001–2021?
- Which U.S. regions and counties show statistically significant increases or decreases in HCW exposure?
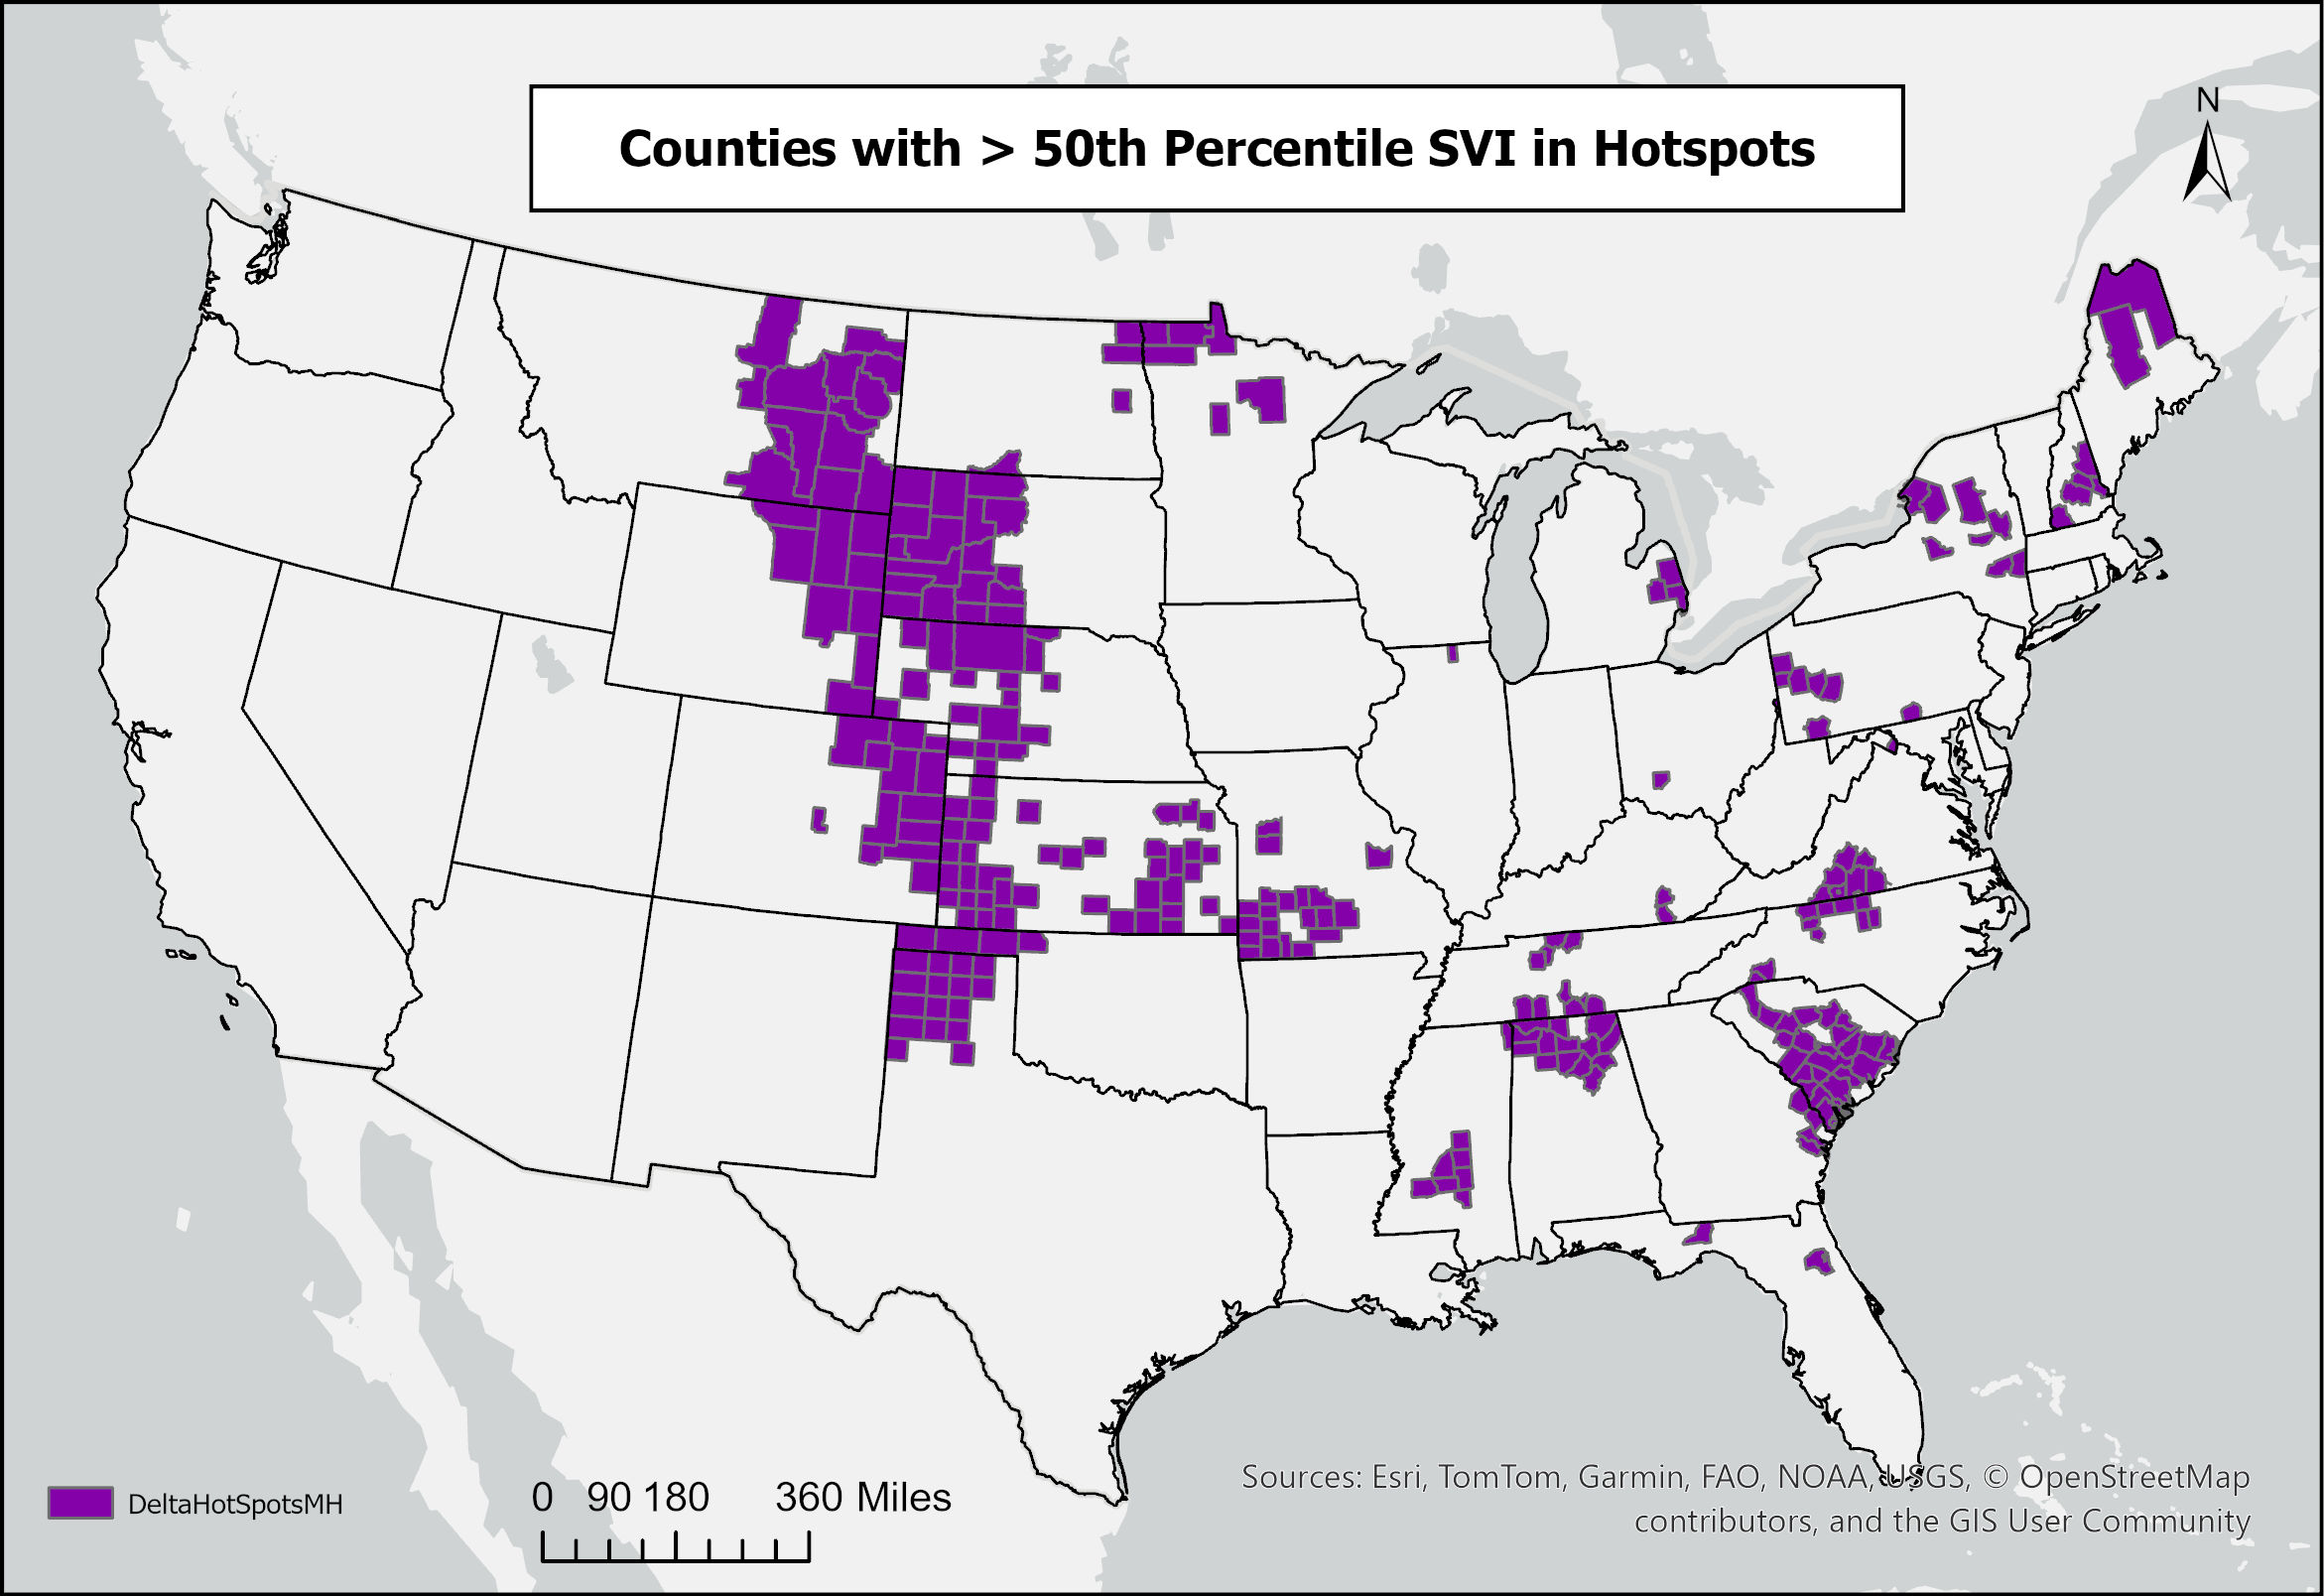
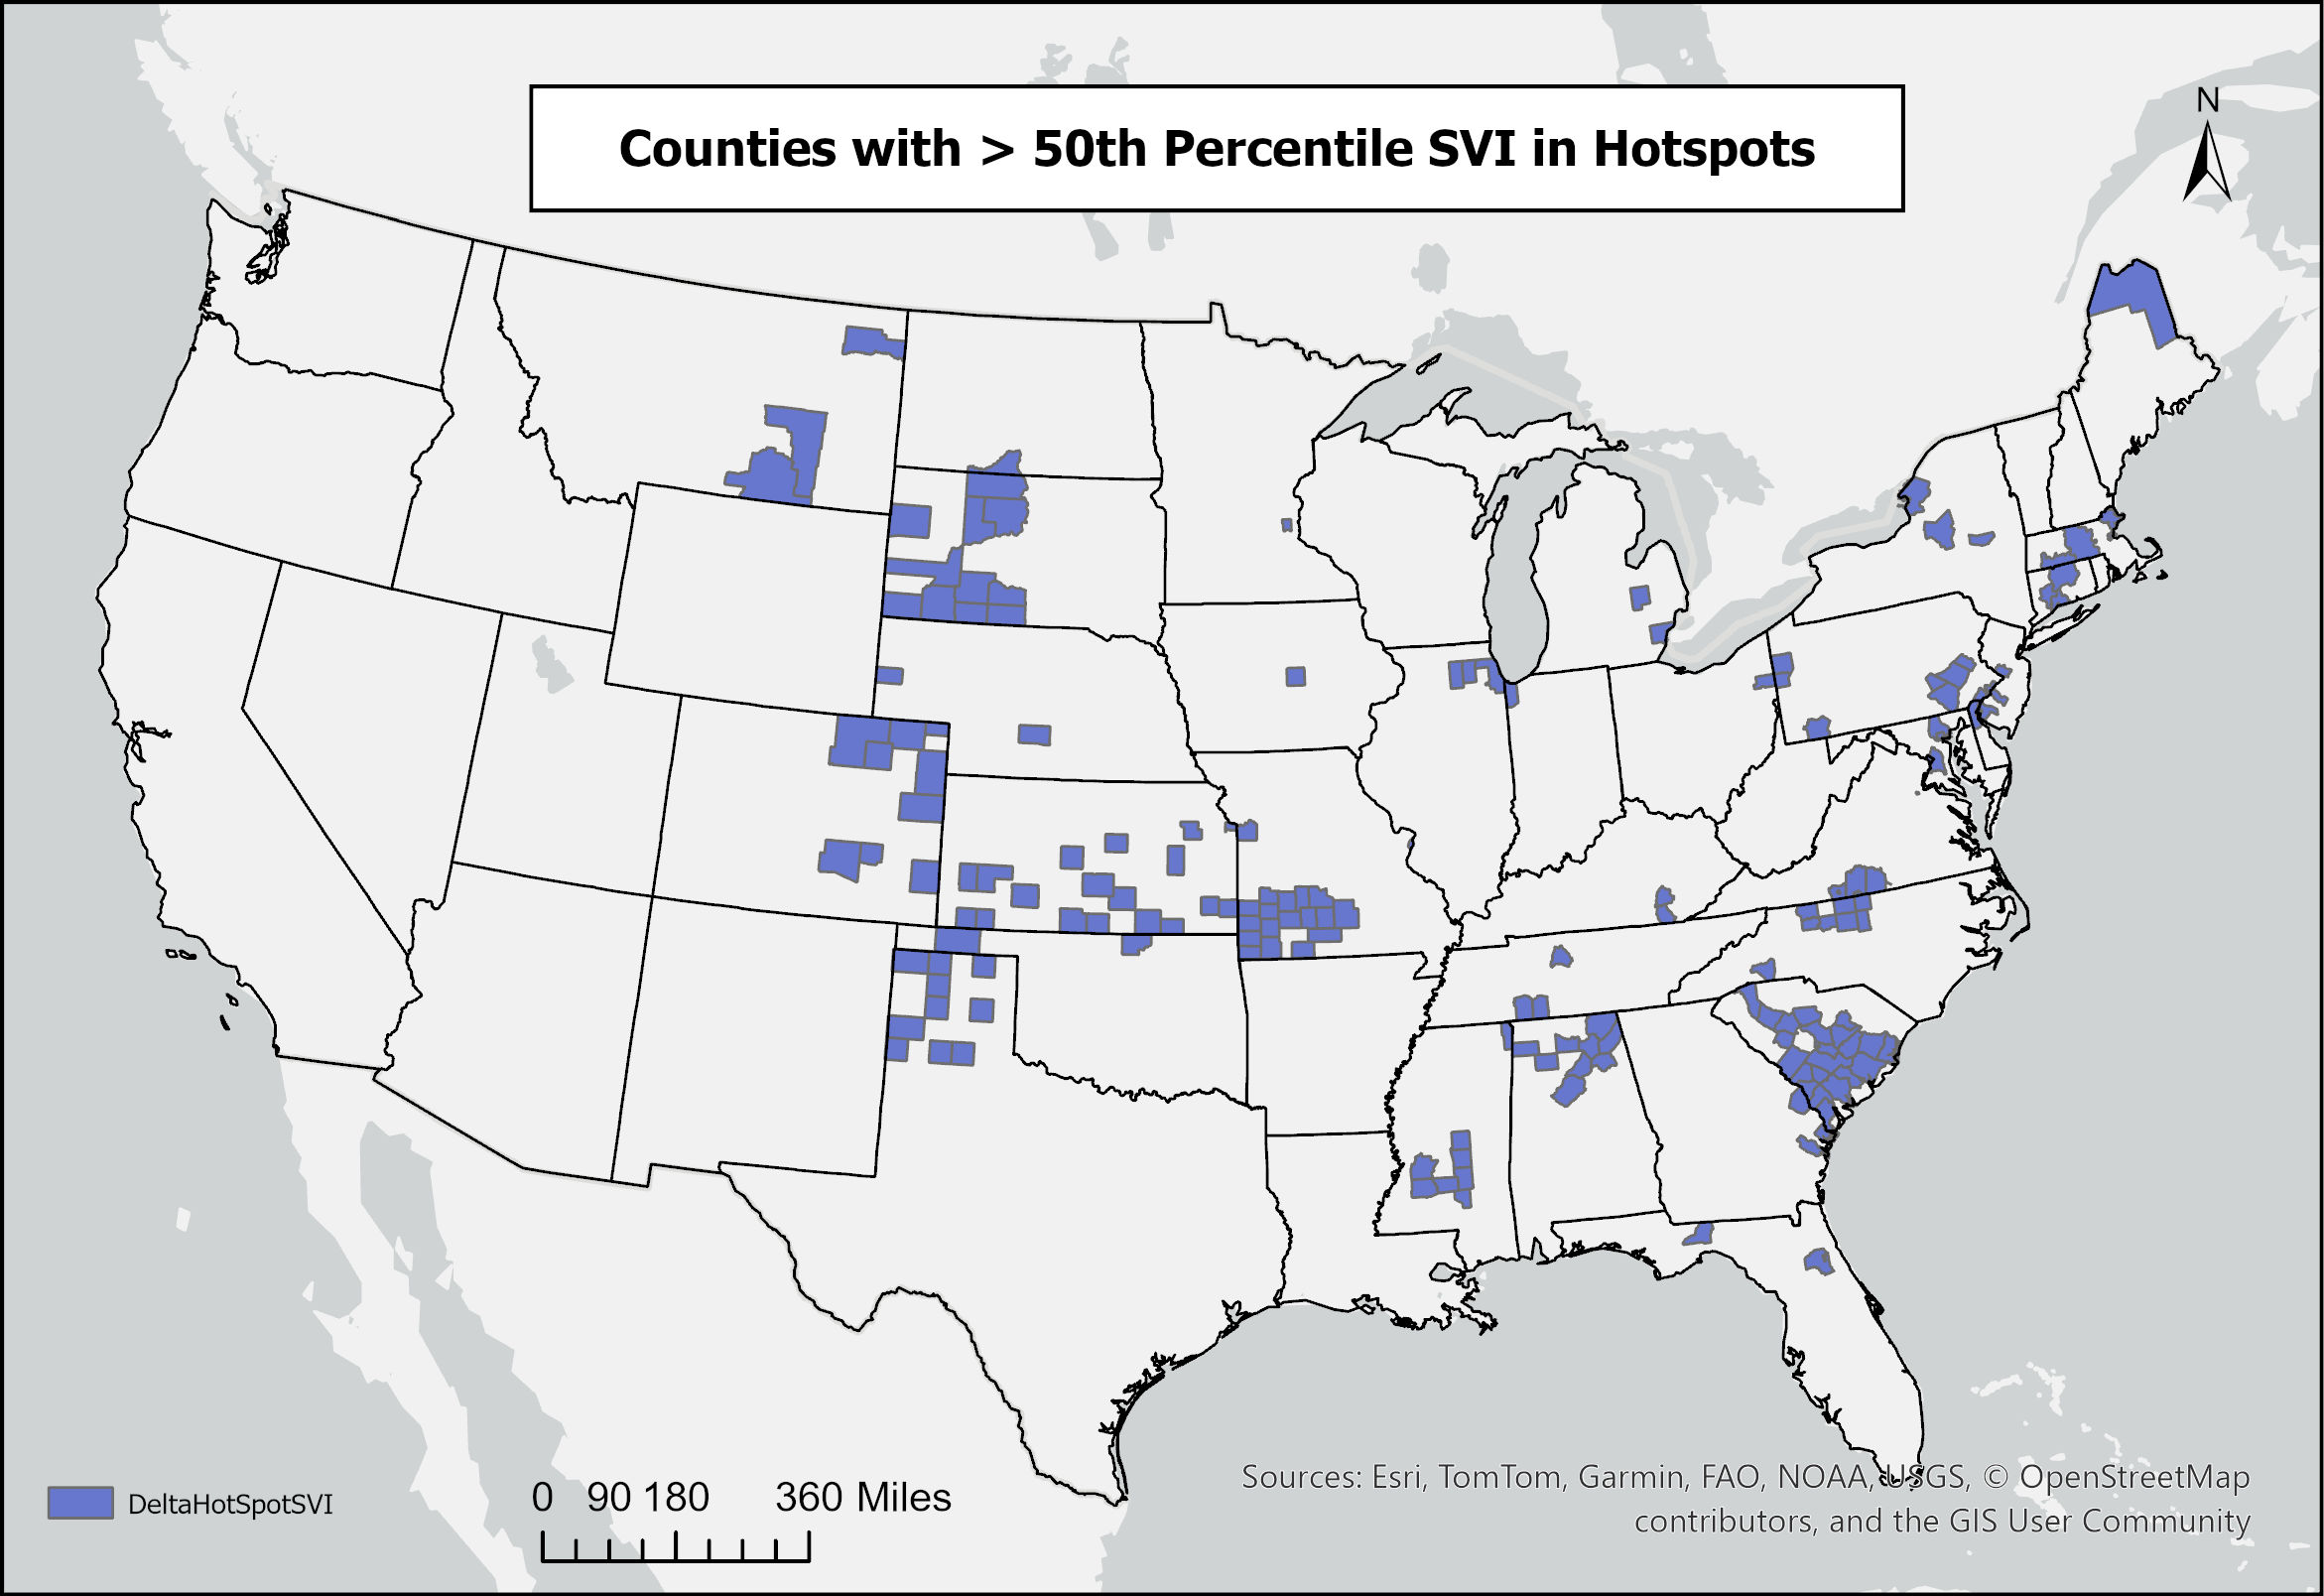
- How are housing units, mobile homes, and socially vulnerable populations distributed across these hotspots?
Background
HCW events have caused over half a trillion dollars in damages and thousands of fatalities in the U.S. during the past 40 years. While the role of climate change and the expanding built environment in increasing exposure is well established, spatial shifts in housing and vulnerability exposure to HCW are less studied. Mobile homes, which comprise only 5.7% of total housing but account for over half of HCW-related fatalities, represent a critical focus for vulnerability analysis.
Methods & Data
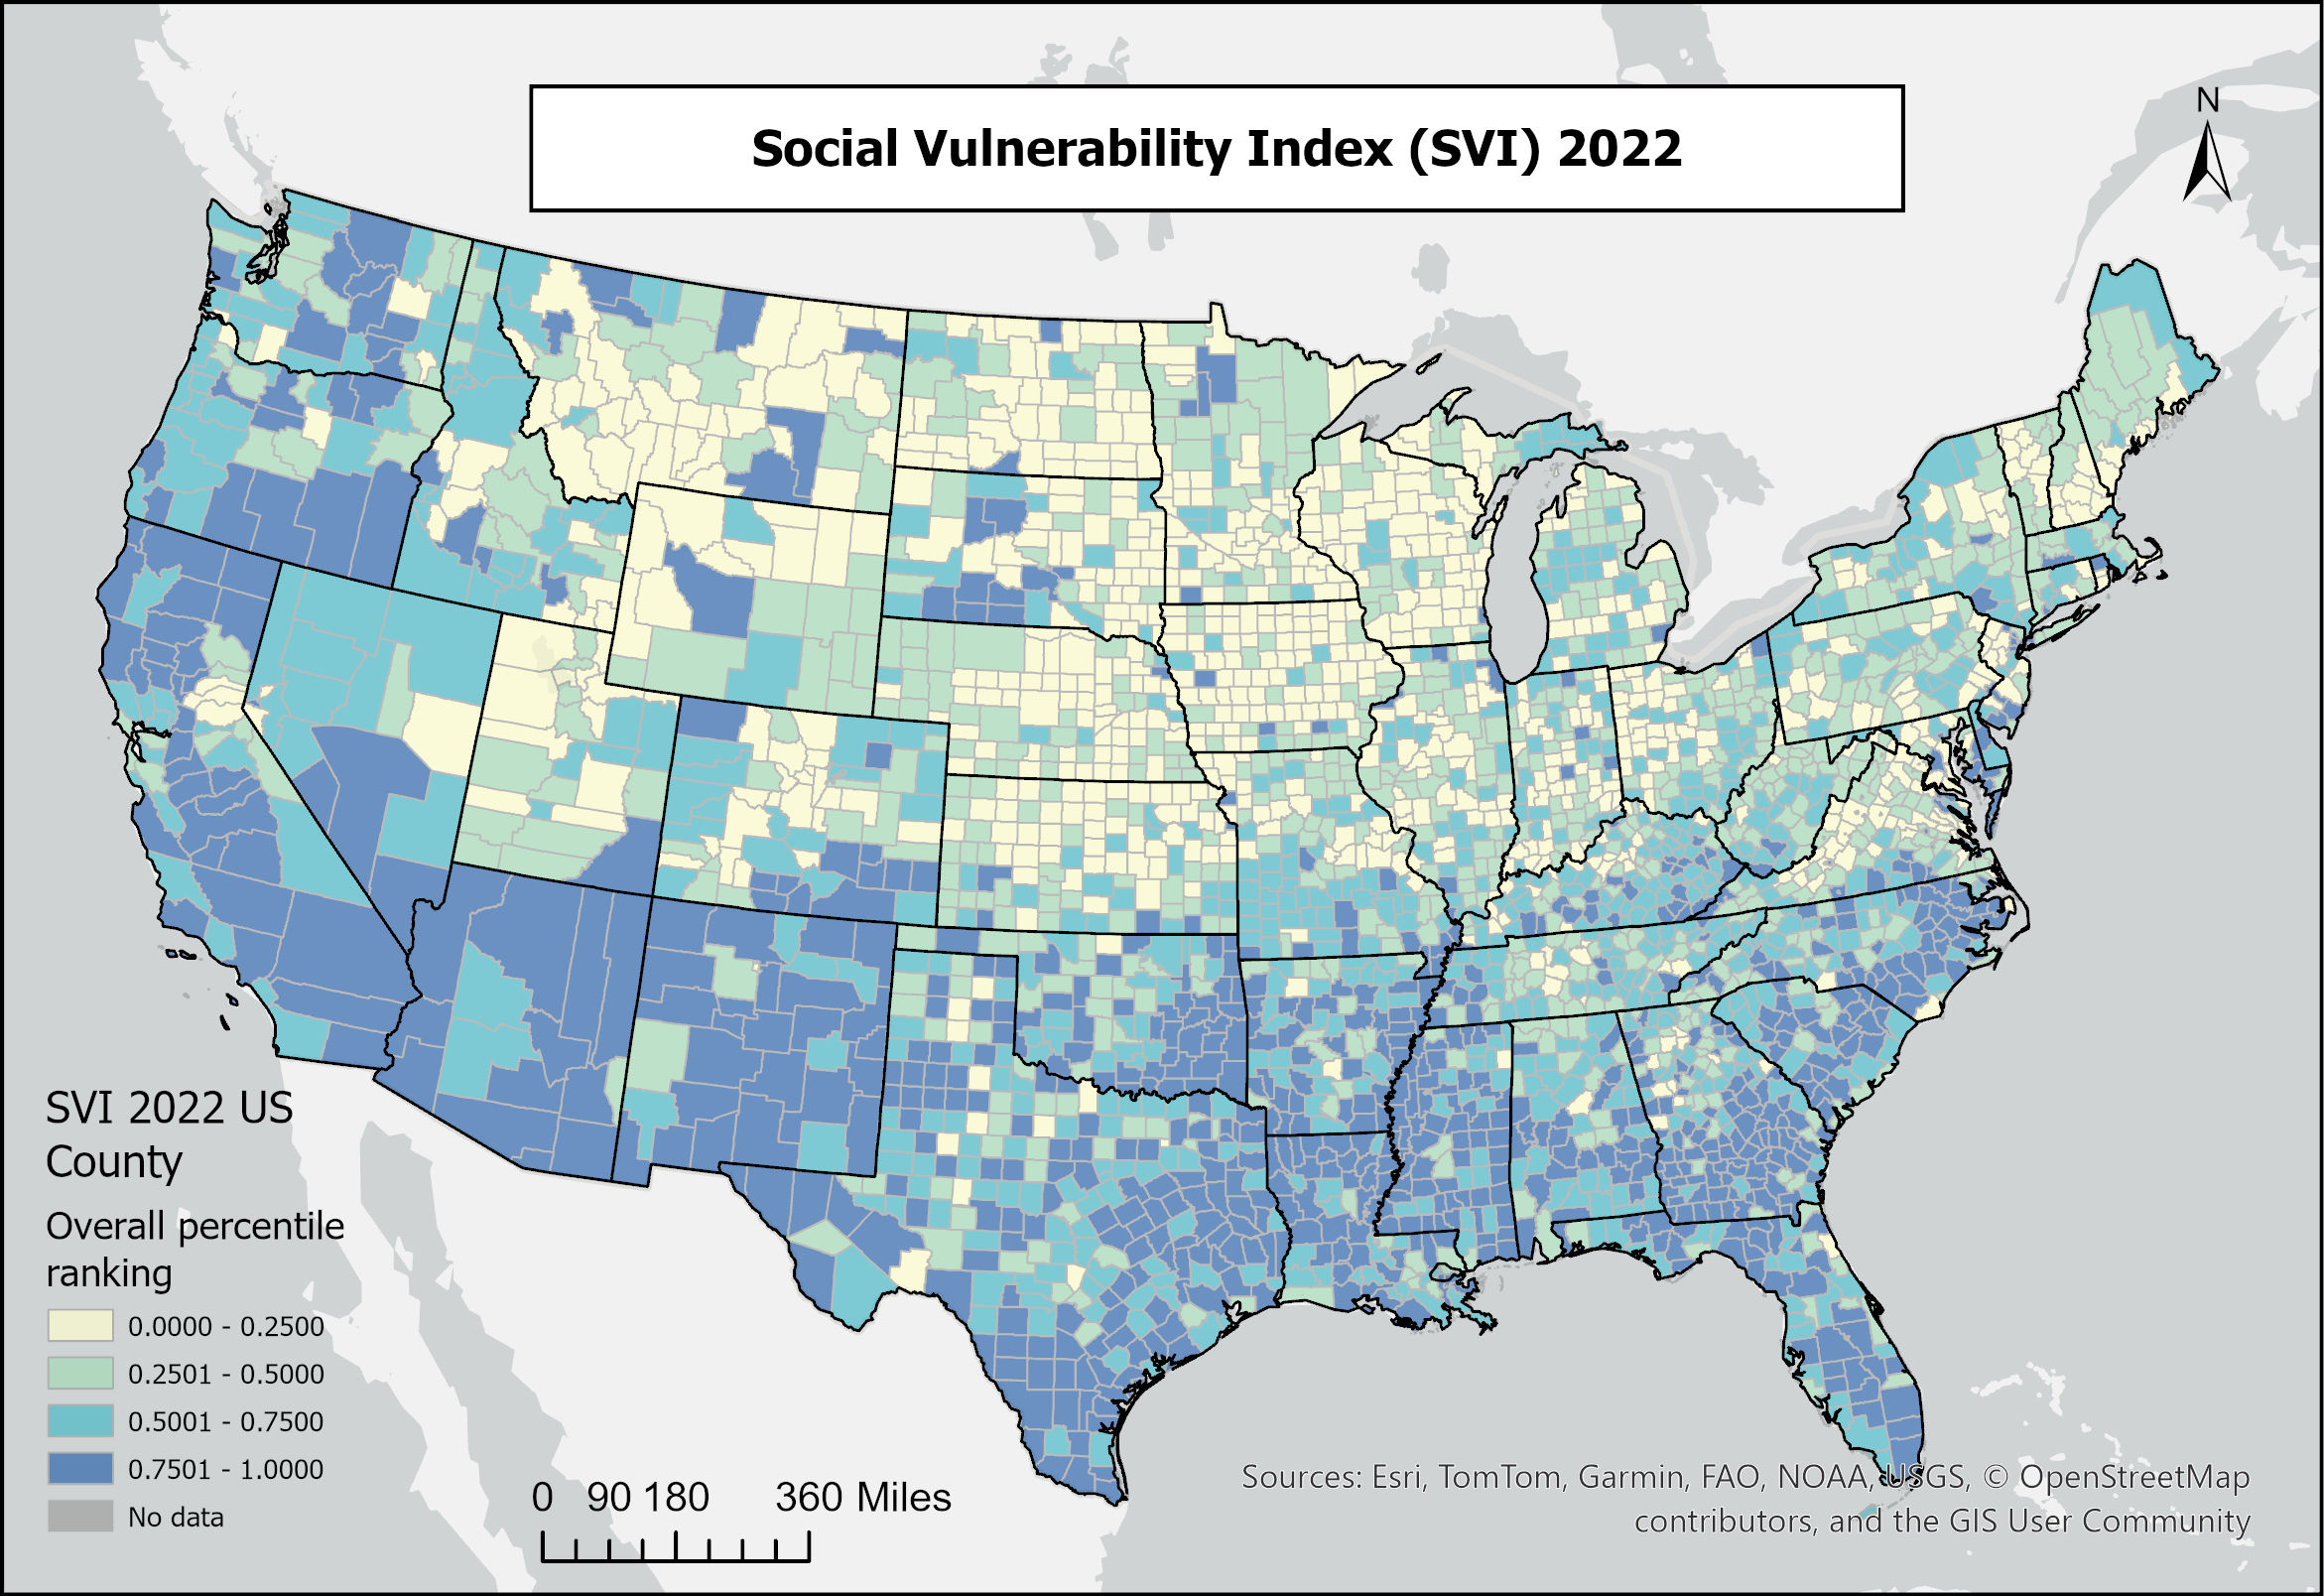
Data Sources: NOAA SPC Severe Report GIS (tornado, wind, hail), American Community Survey housing data, CDC Social Vulnerability Index, HOLC redlining maps, U.S. Census TIGER boundaries.
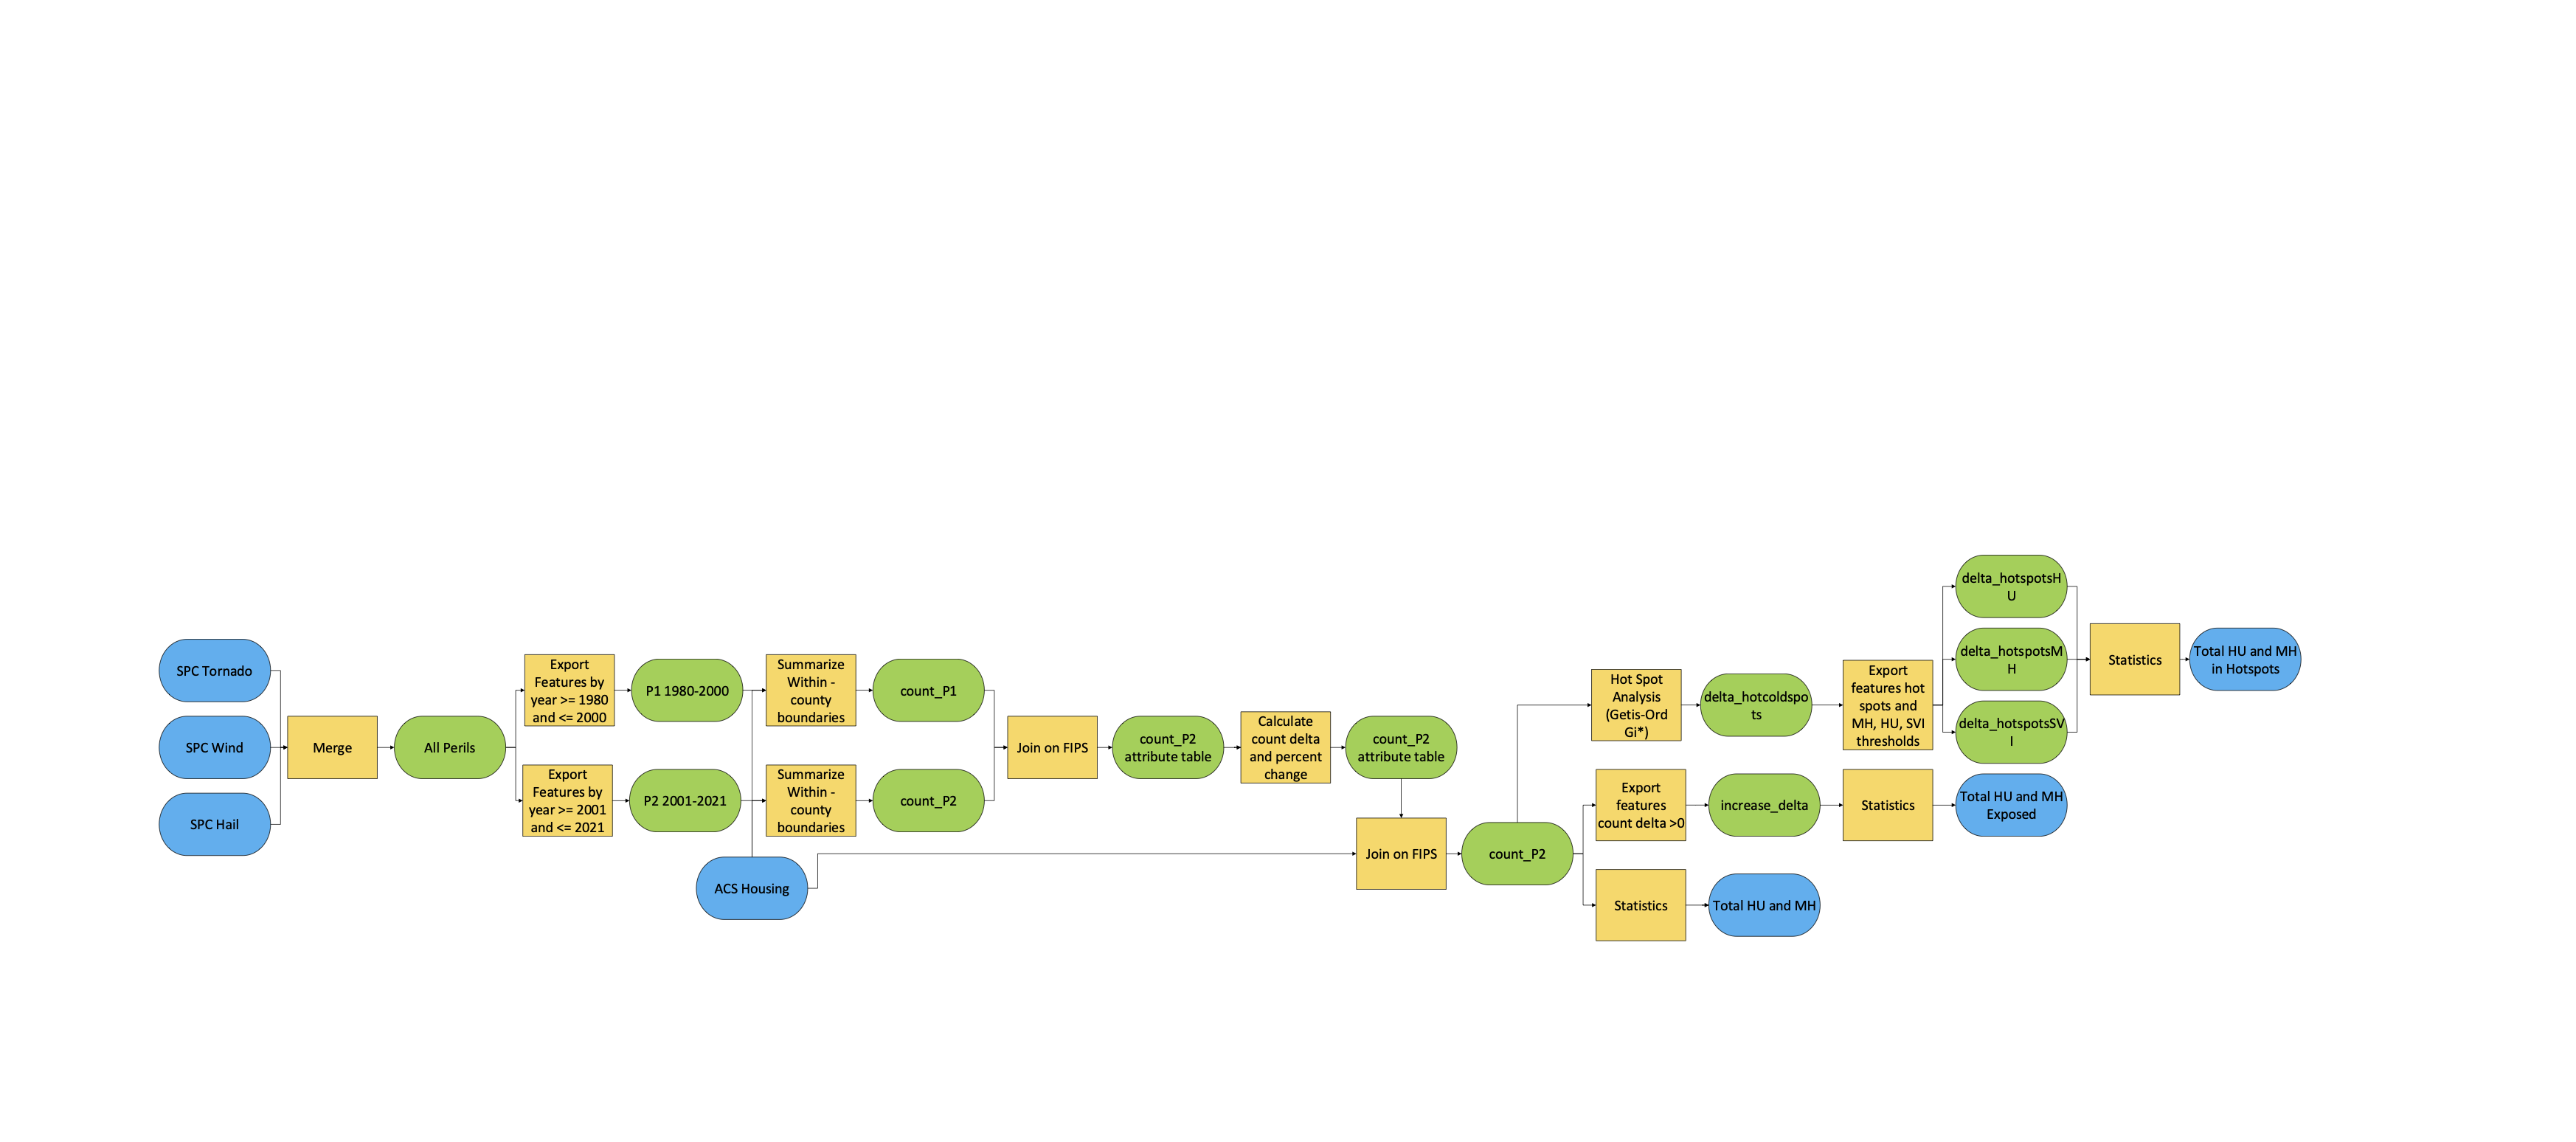
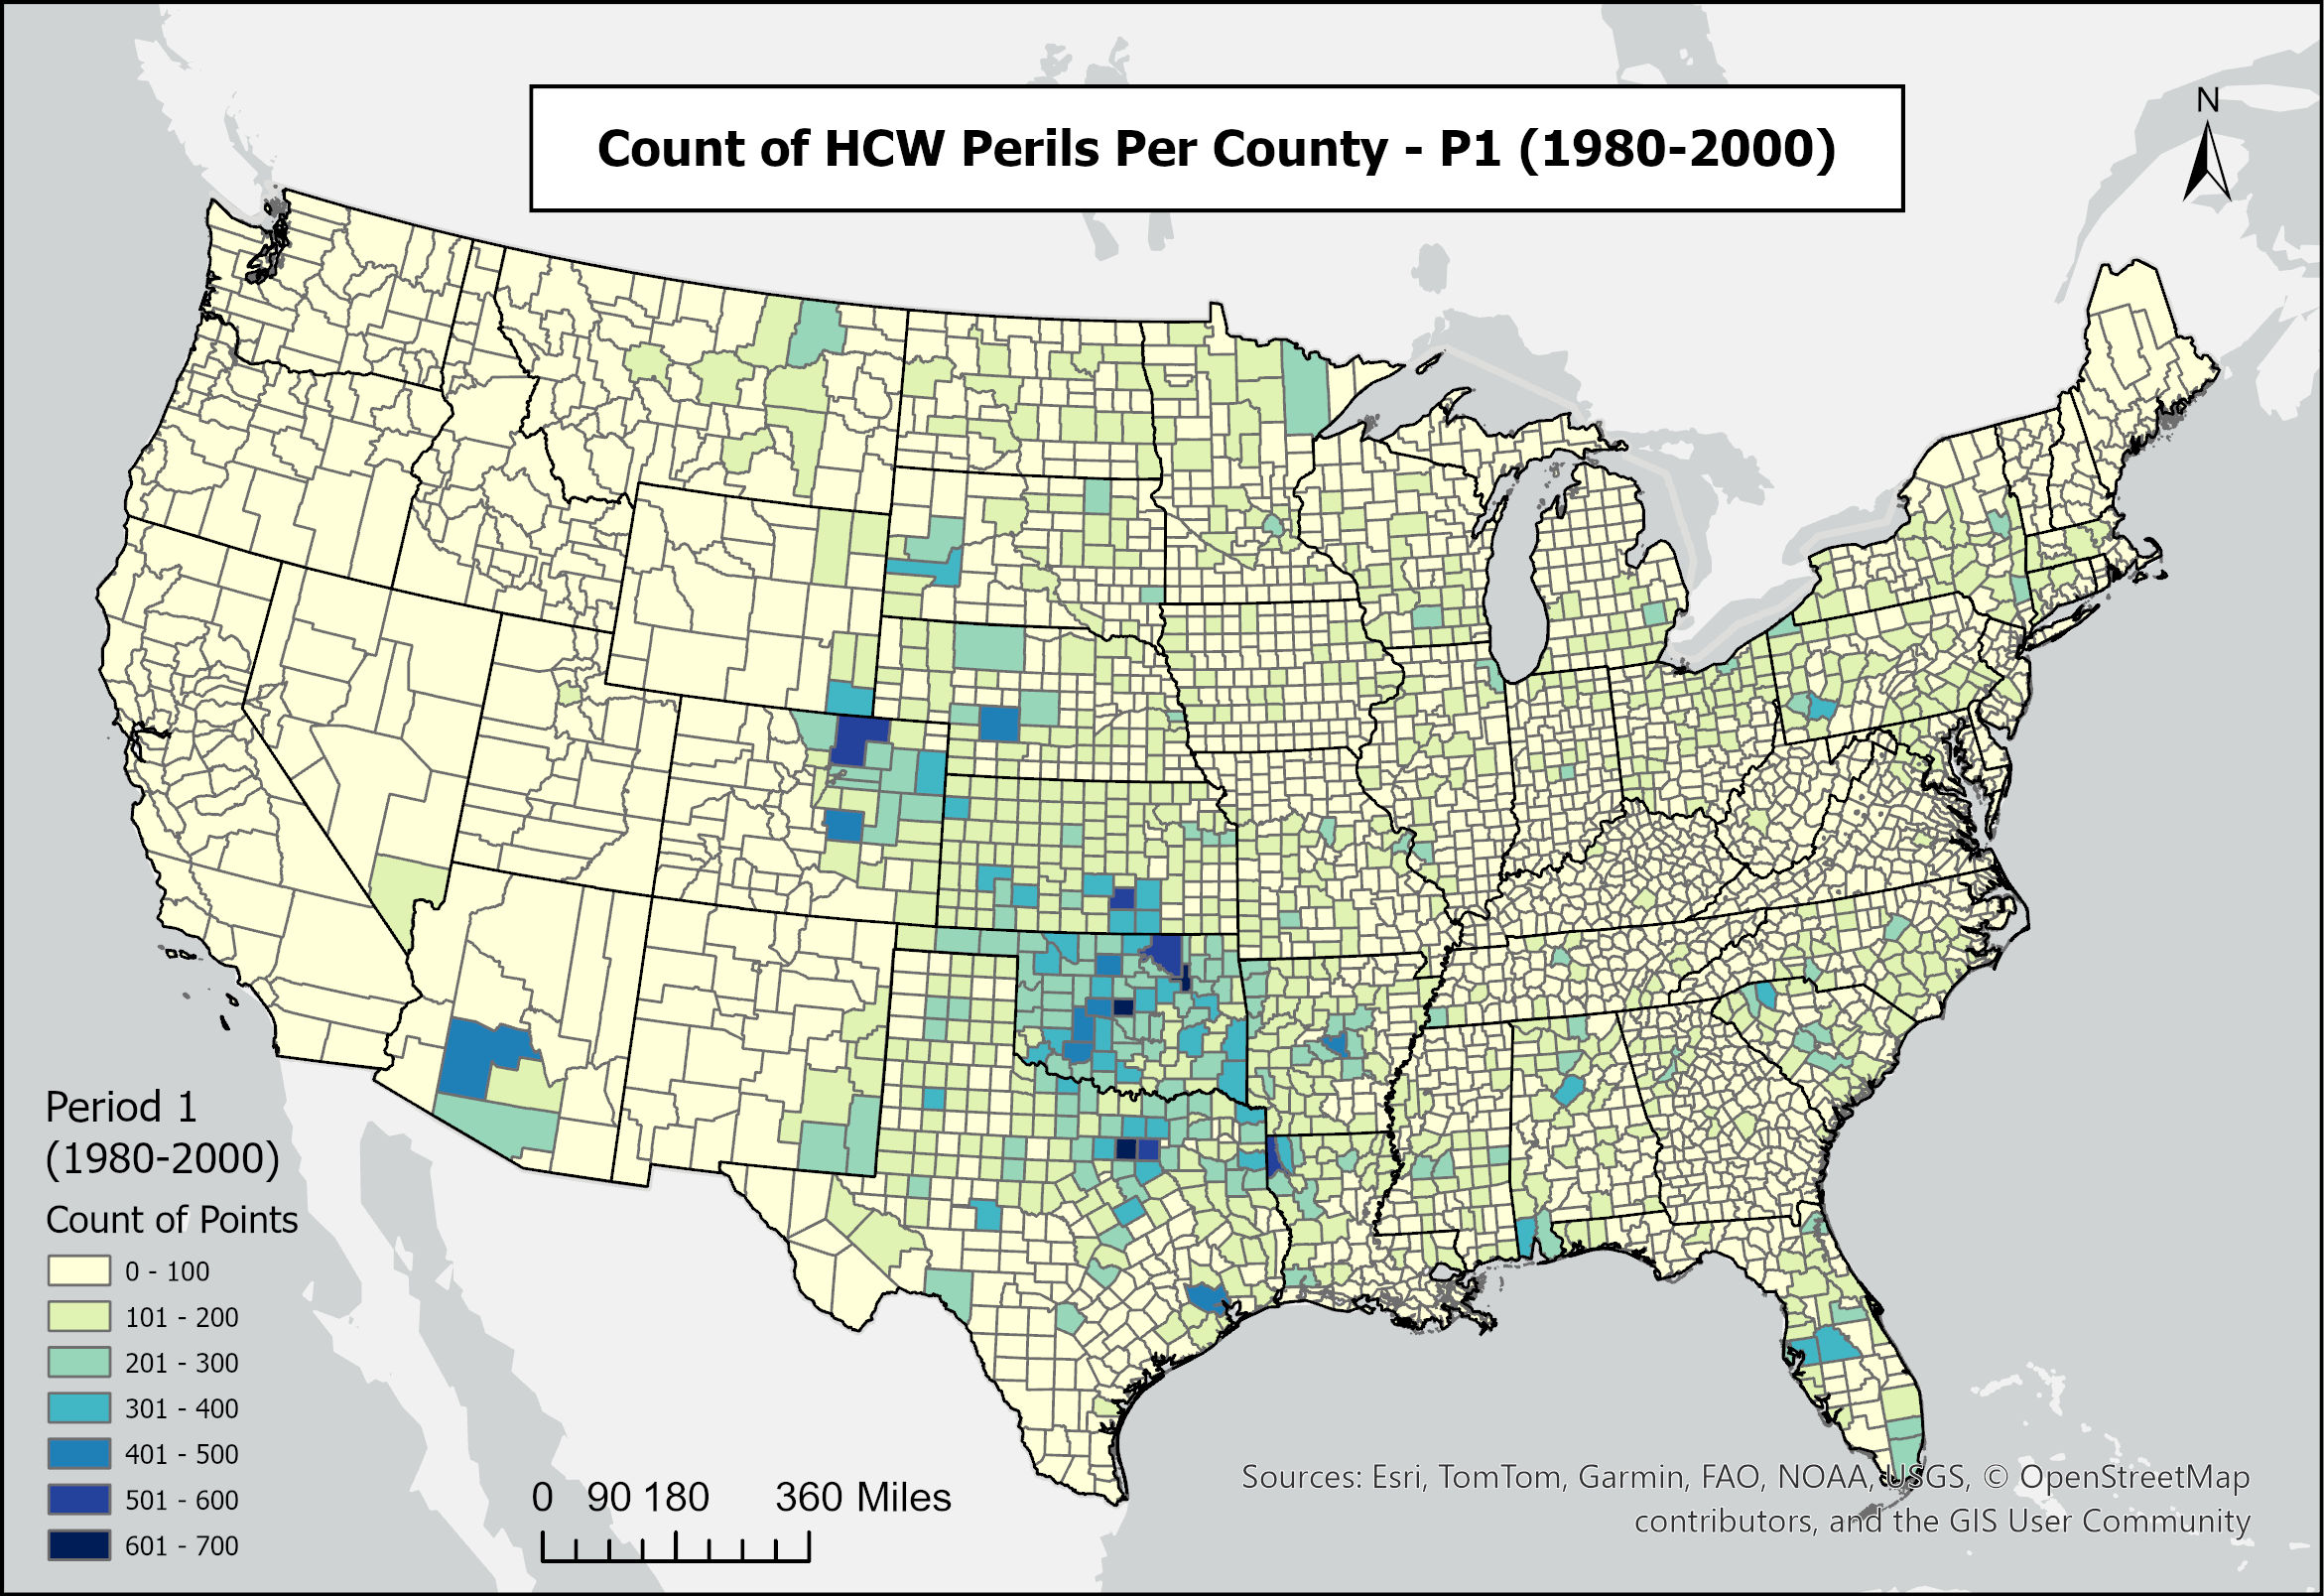
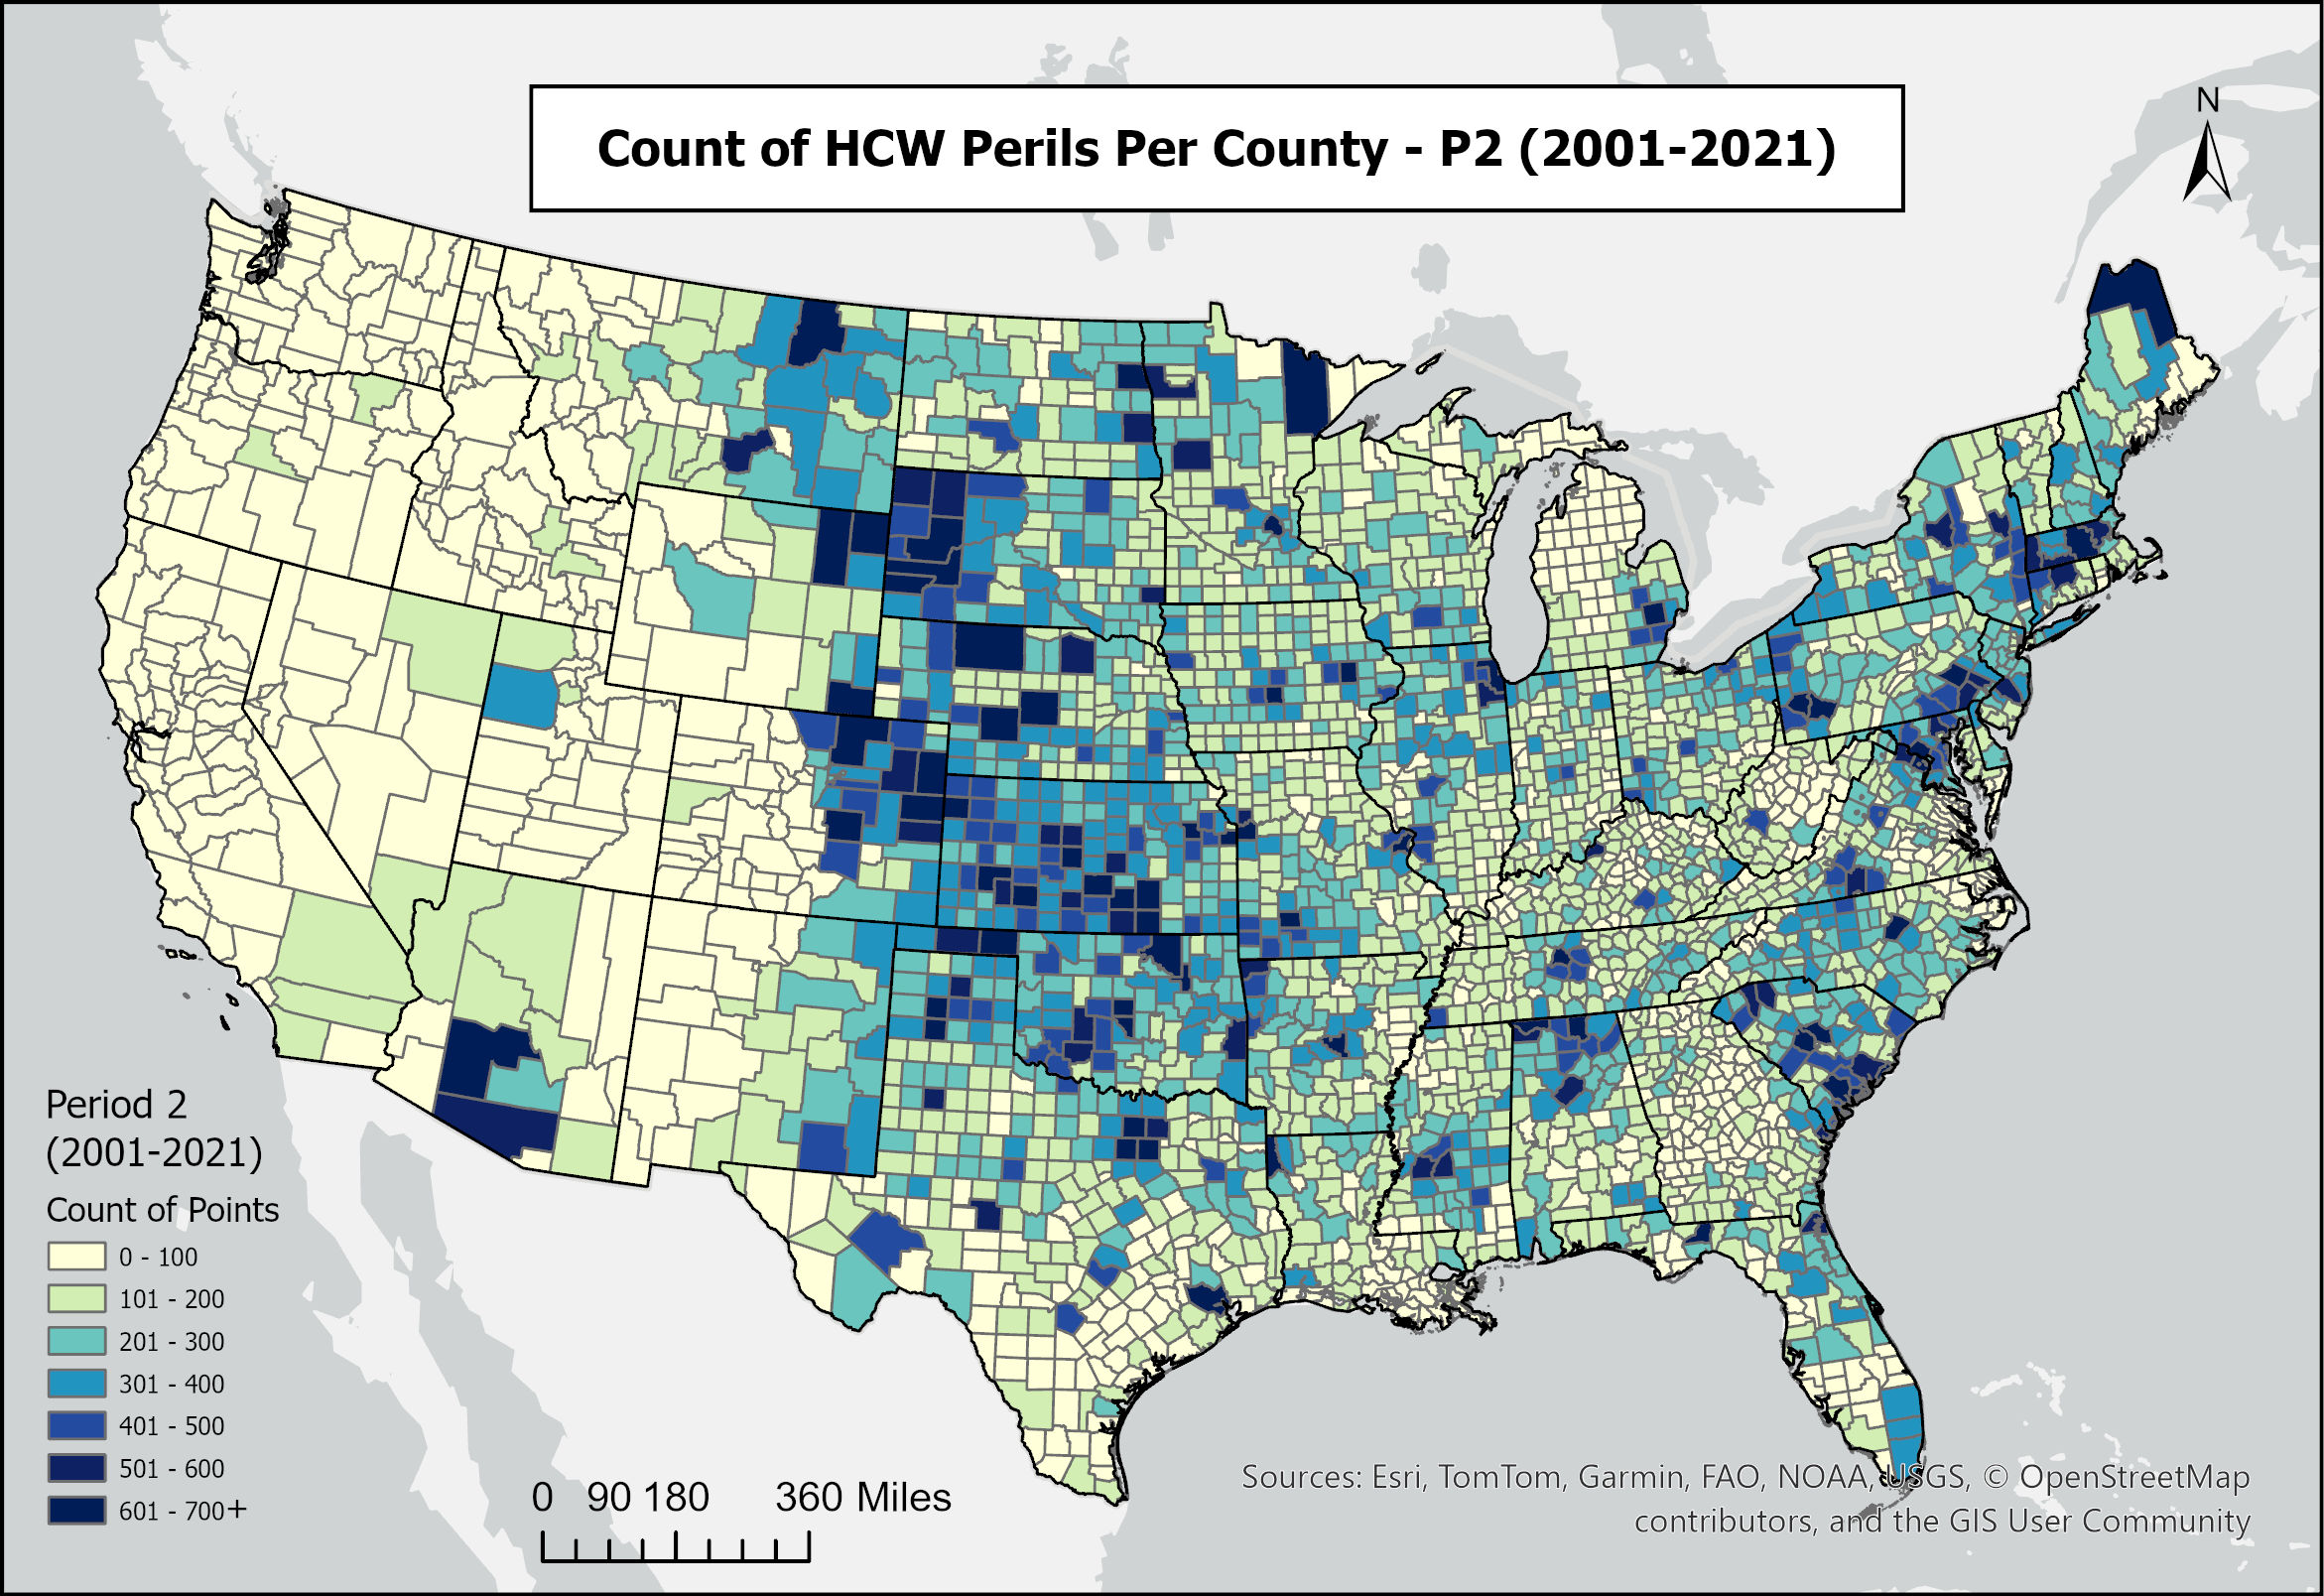
- Climatology: Calculated counts of HCW perils for P1 (1980–2000) and P2 (2001–2021).
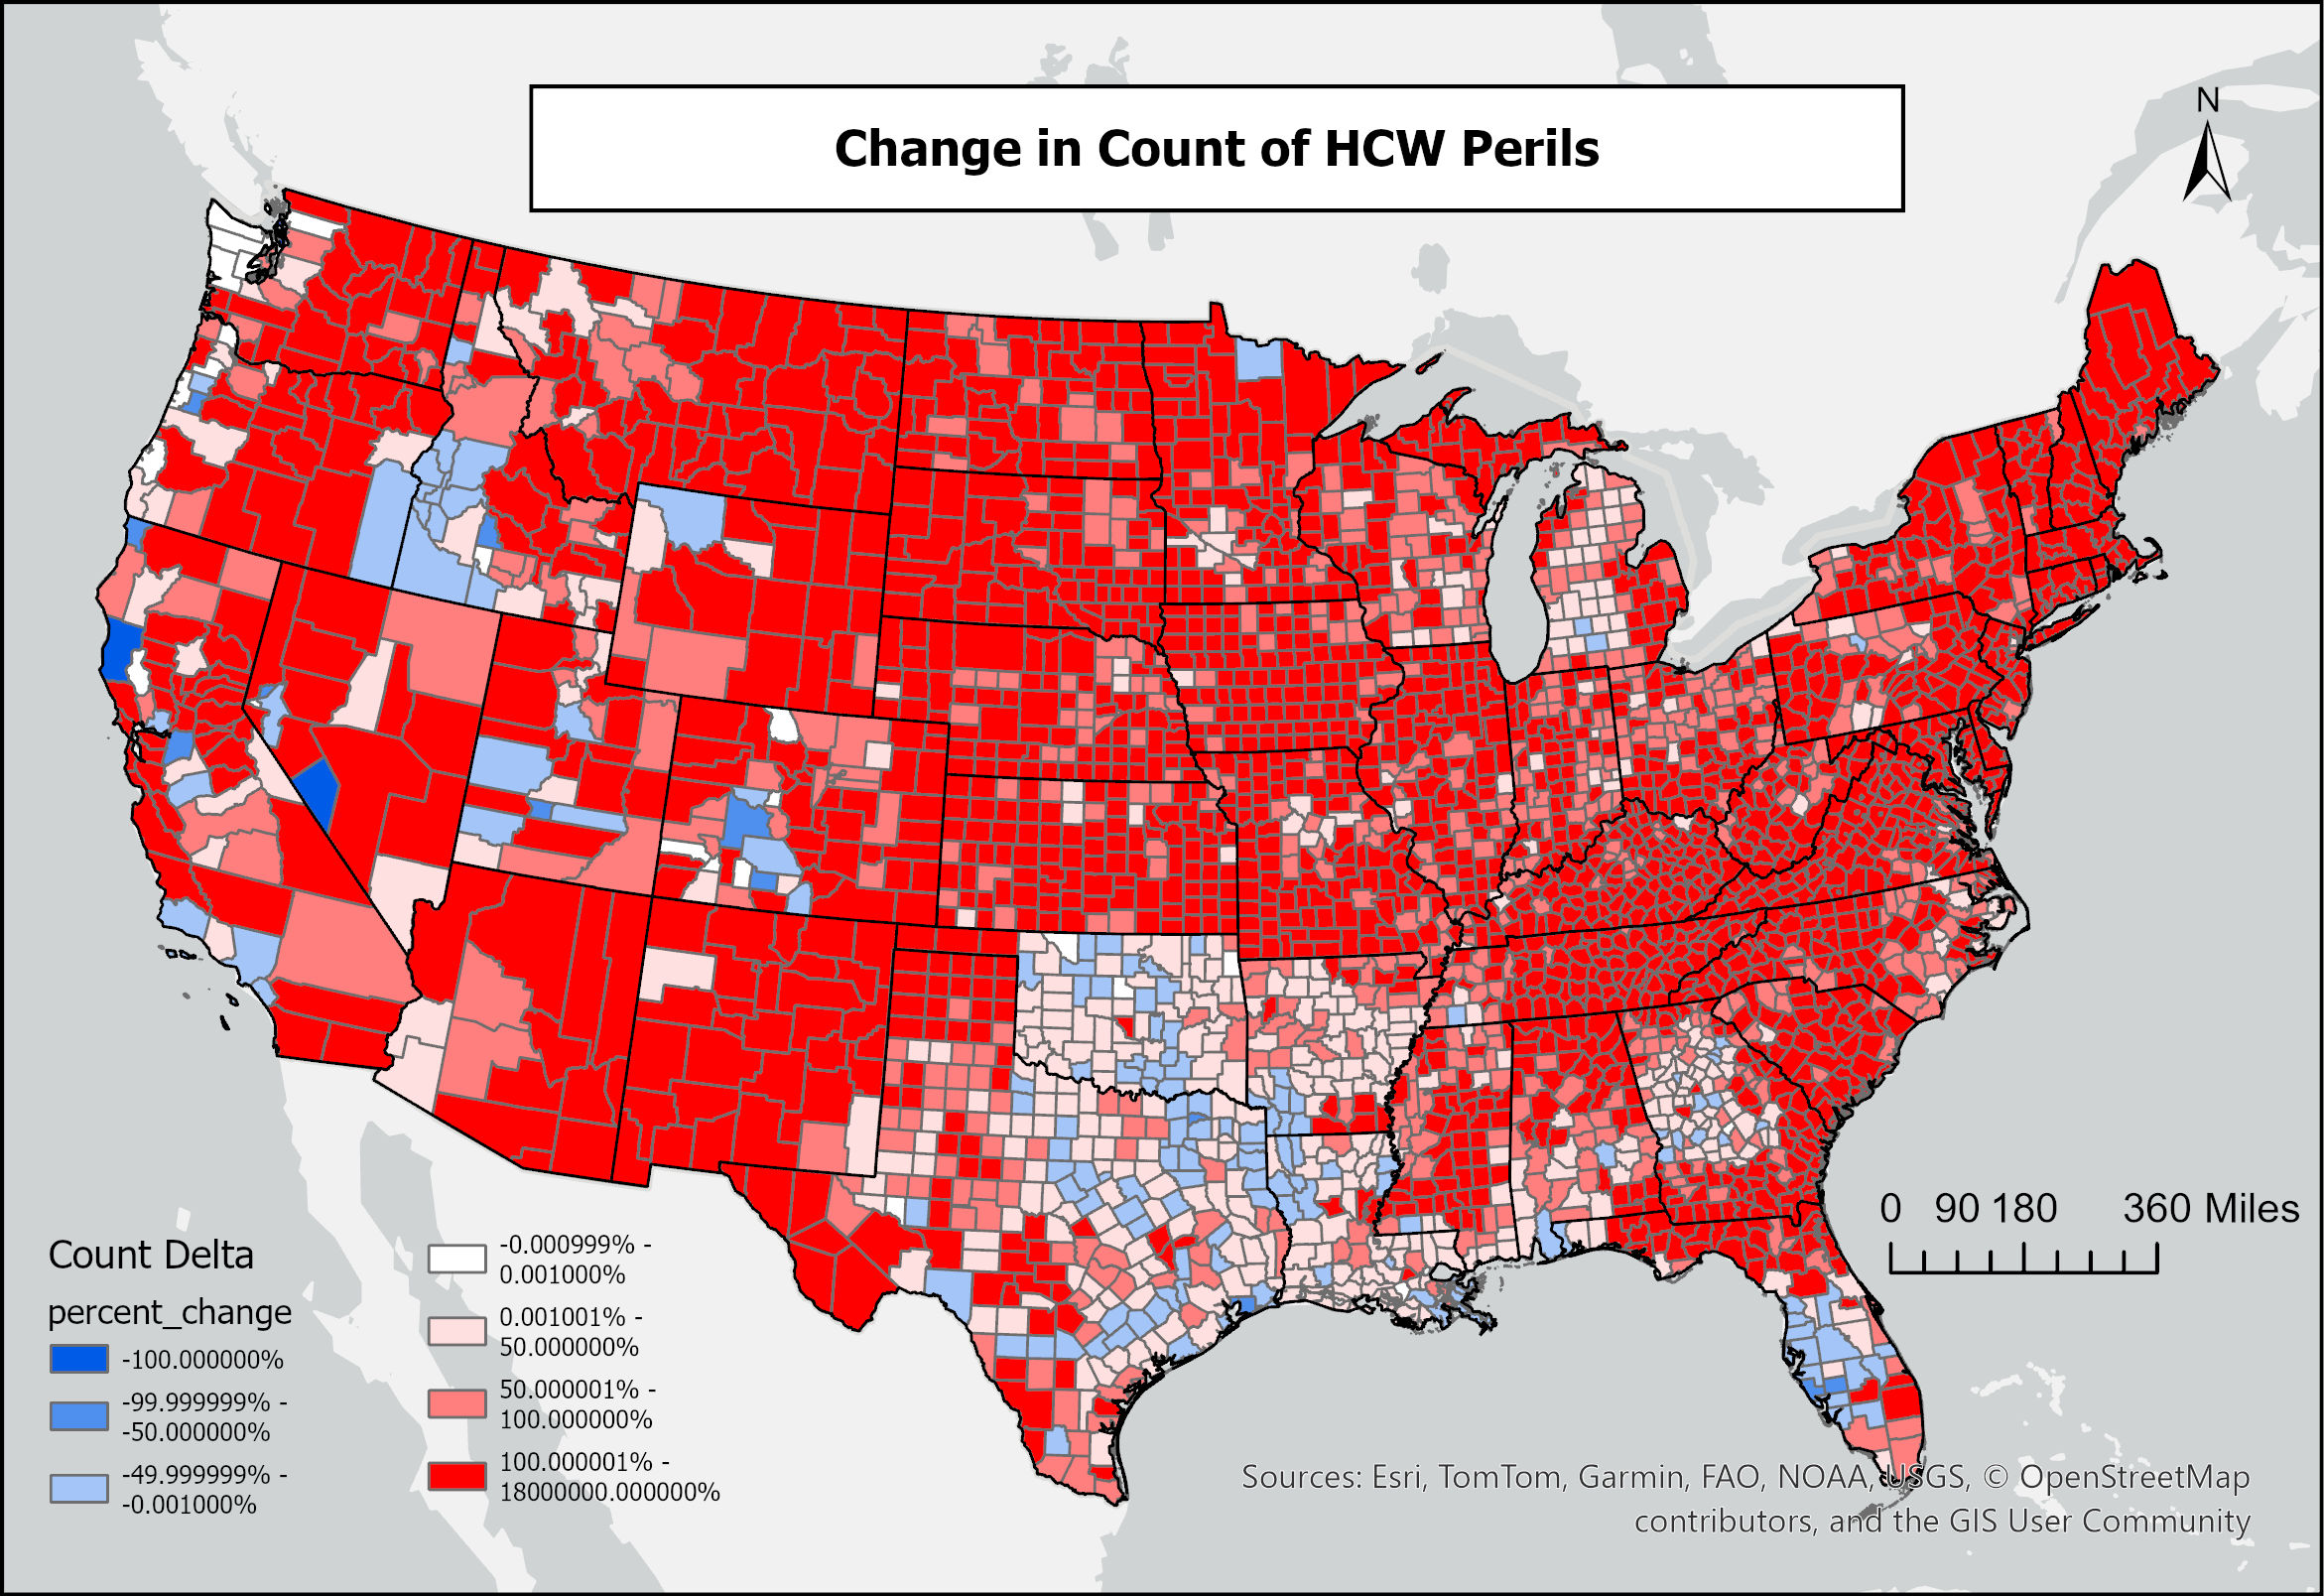
- Delta Analysis: Computed count differences and percent changes per county.
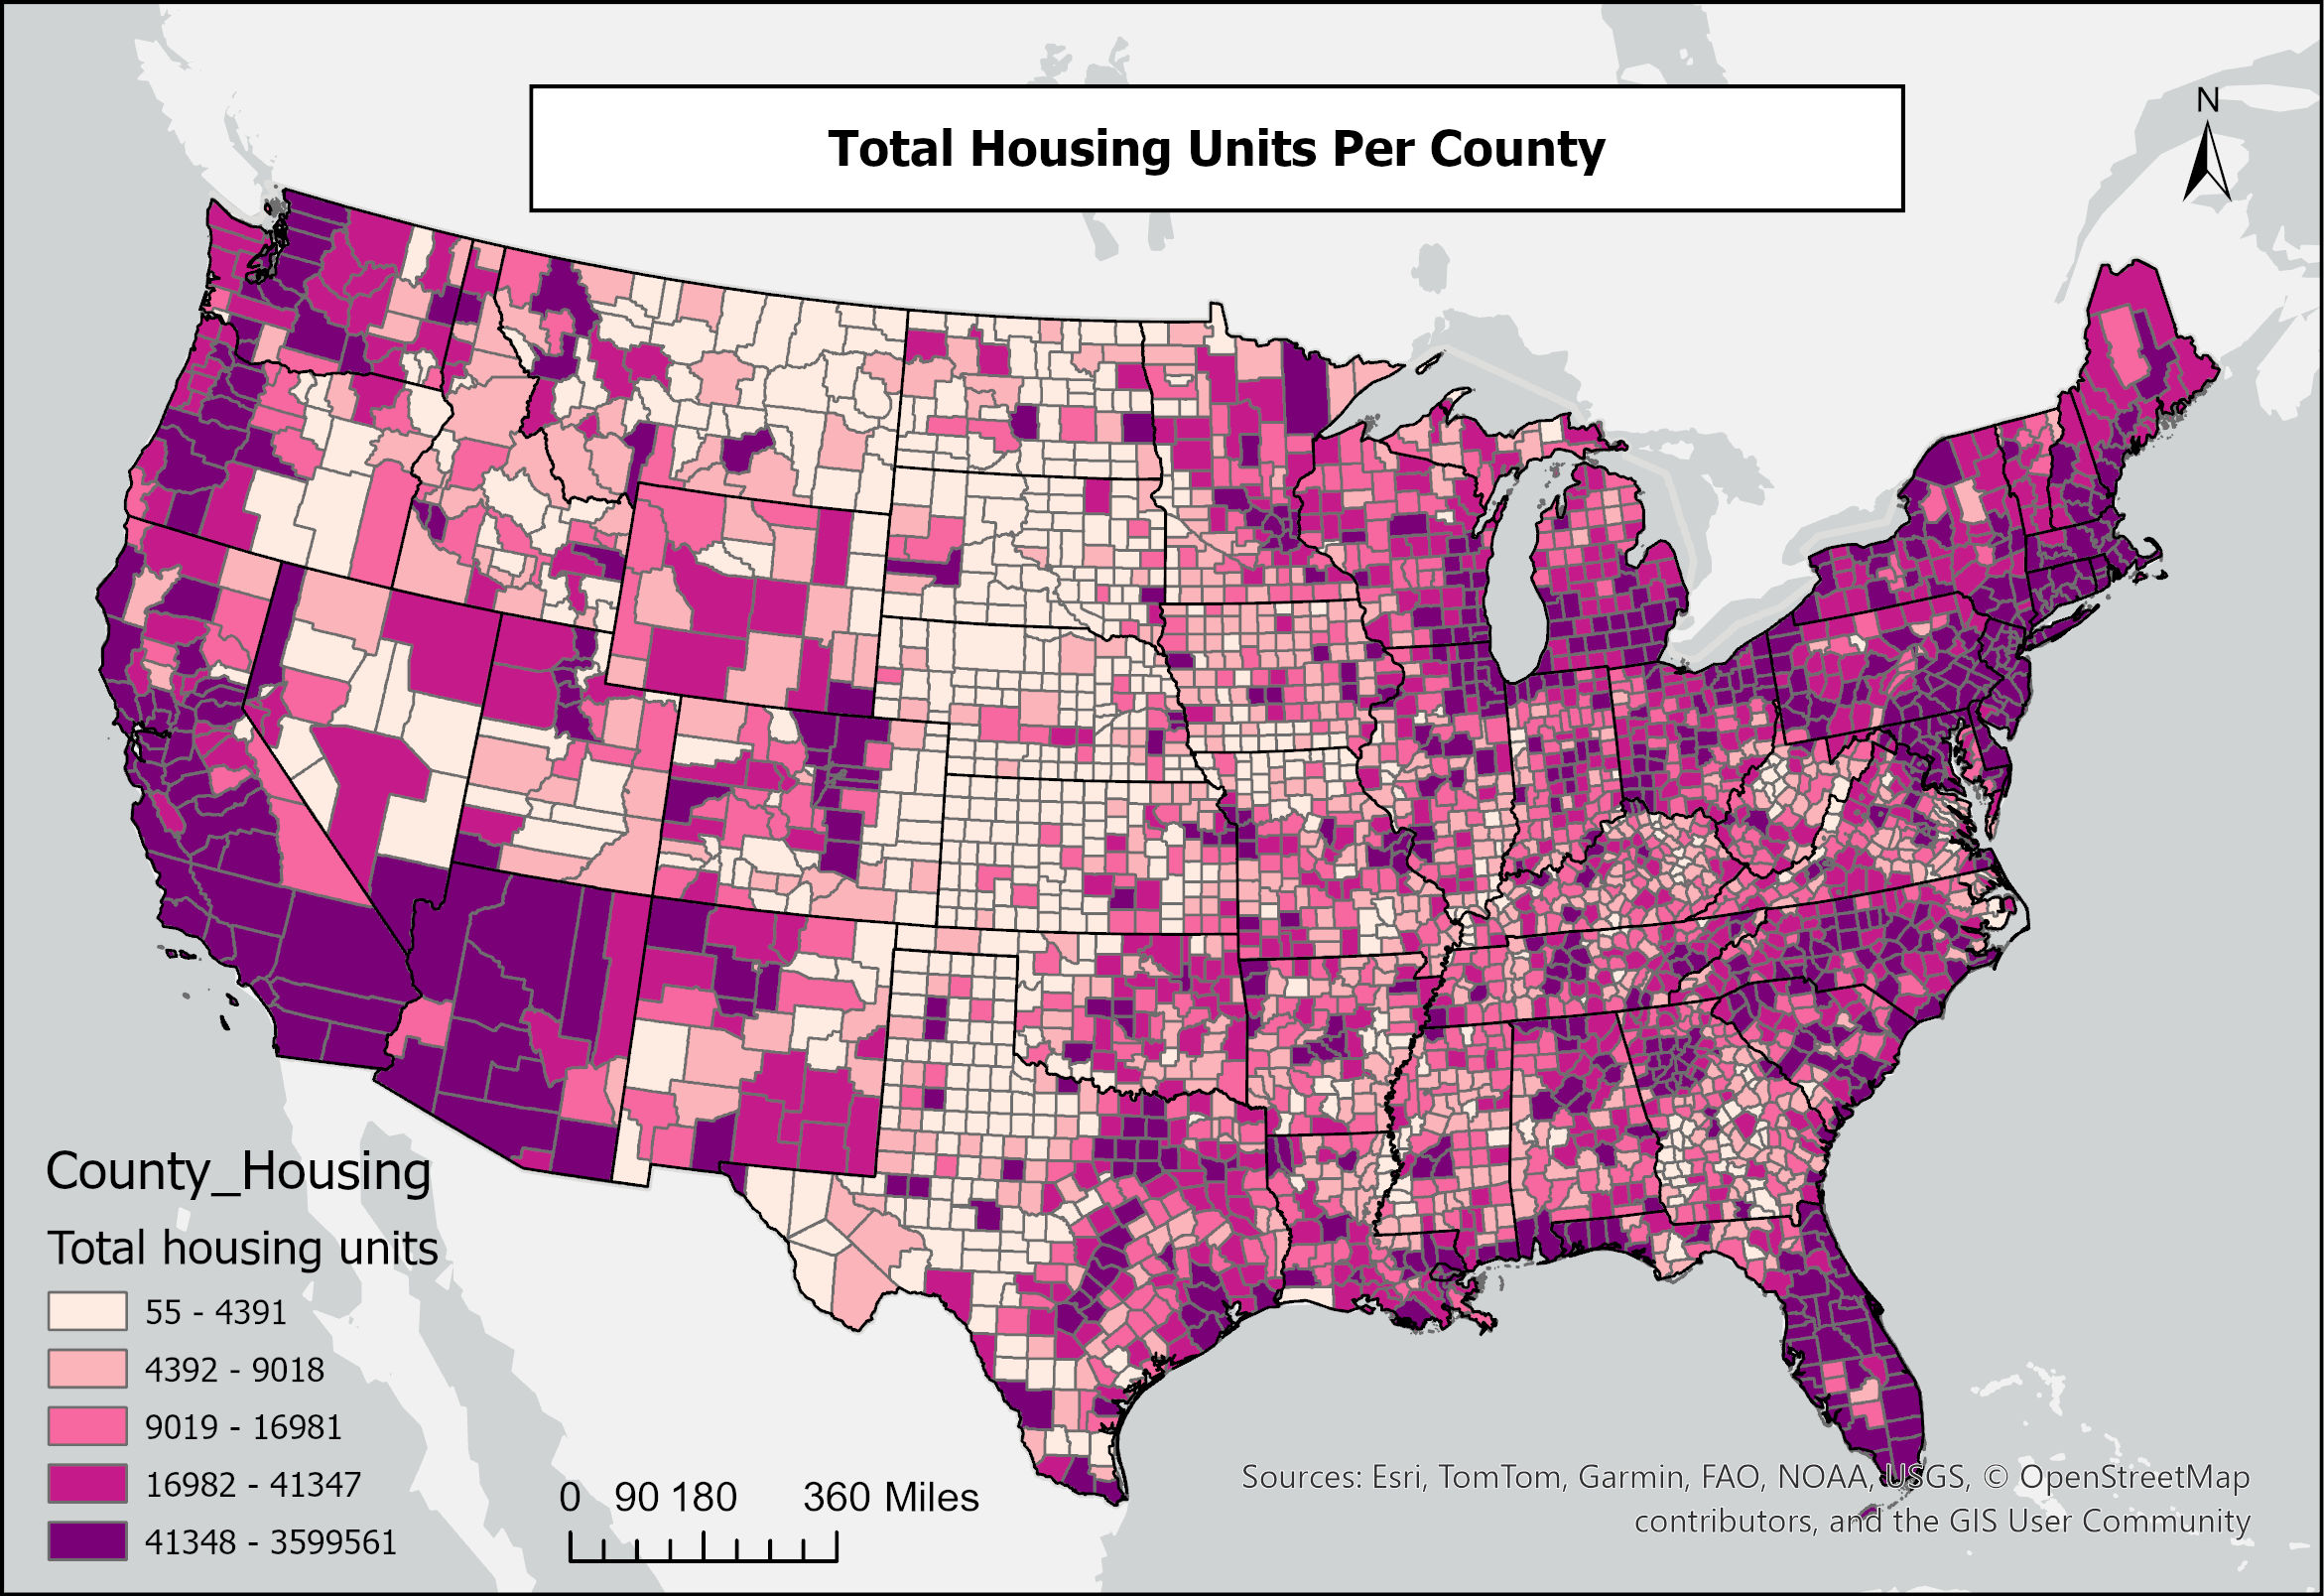
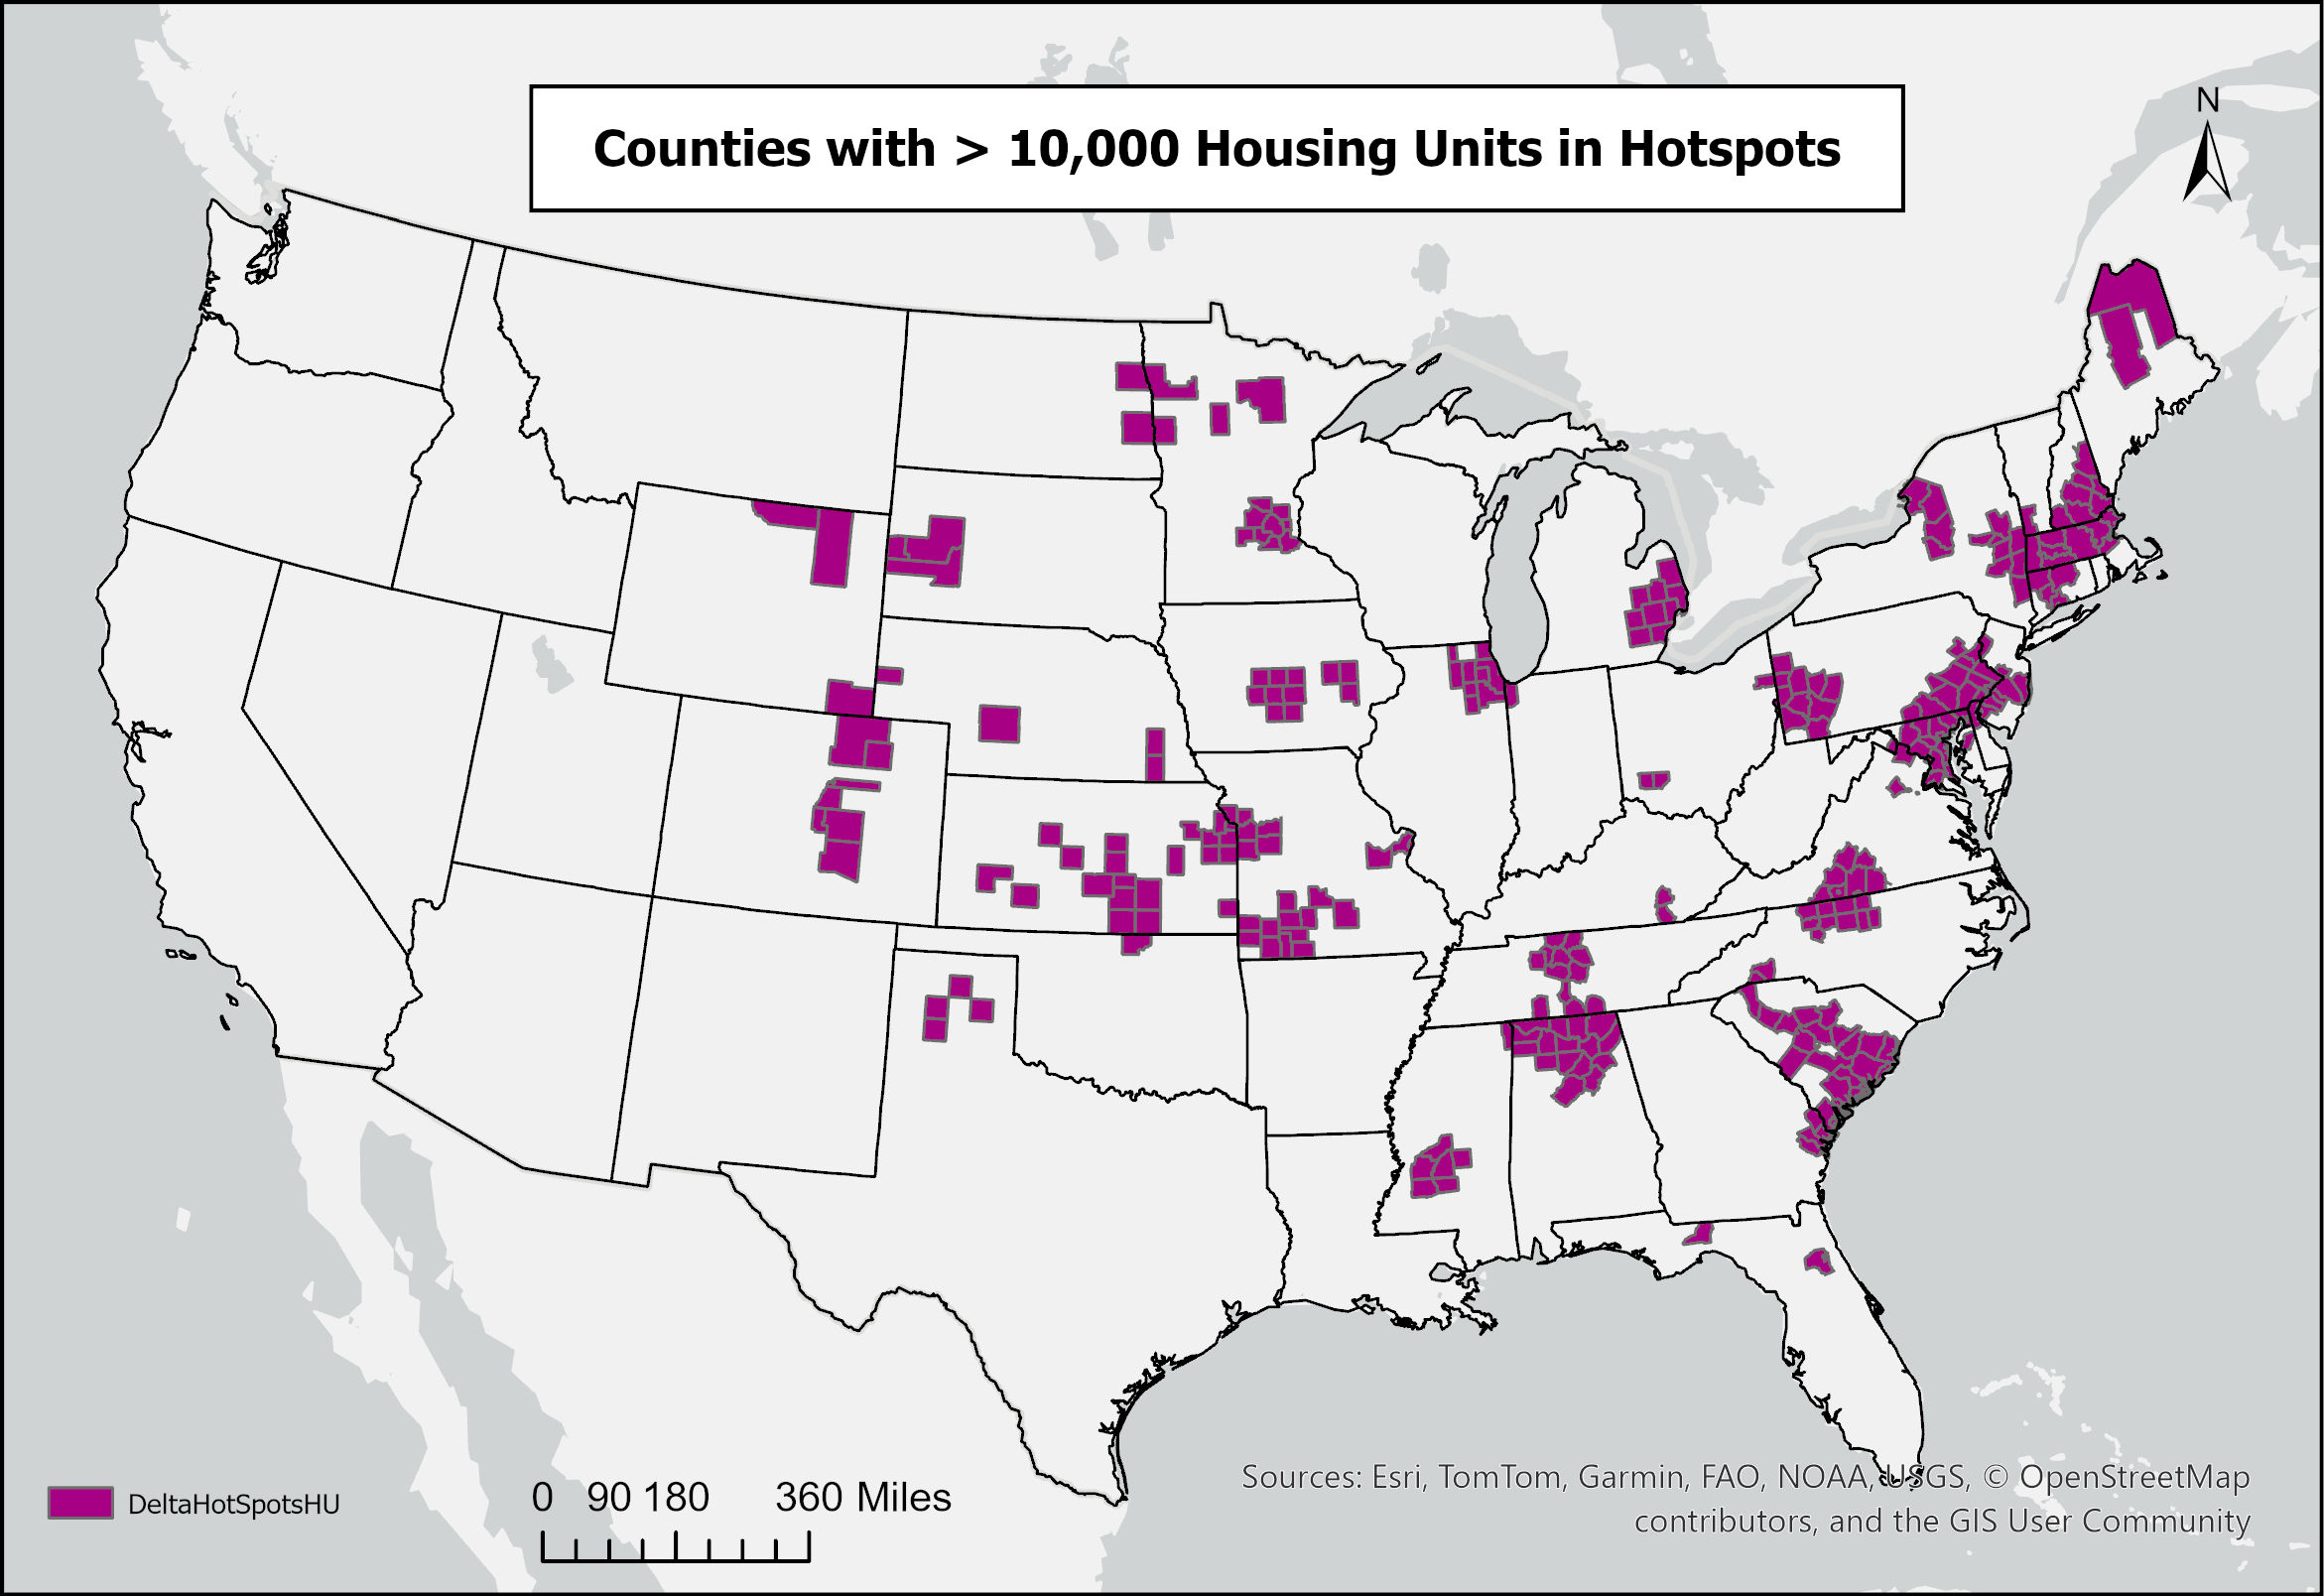
- Exposure Assessment: Linked housing units and mobile homes with counties showing increases.
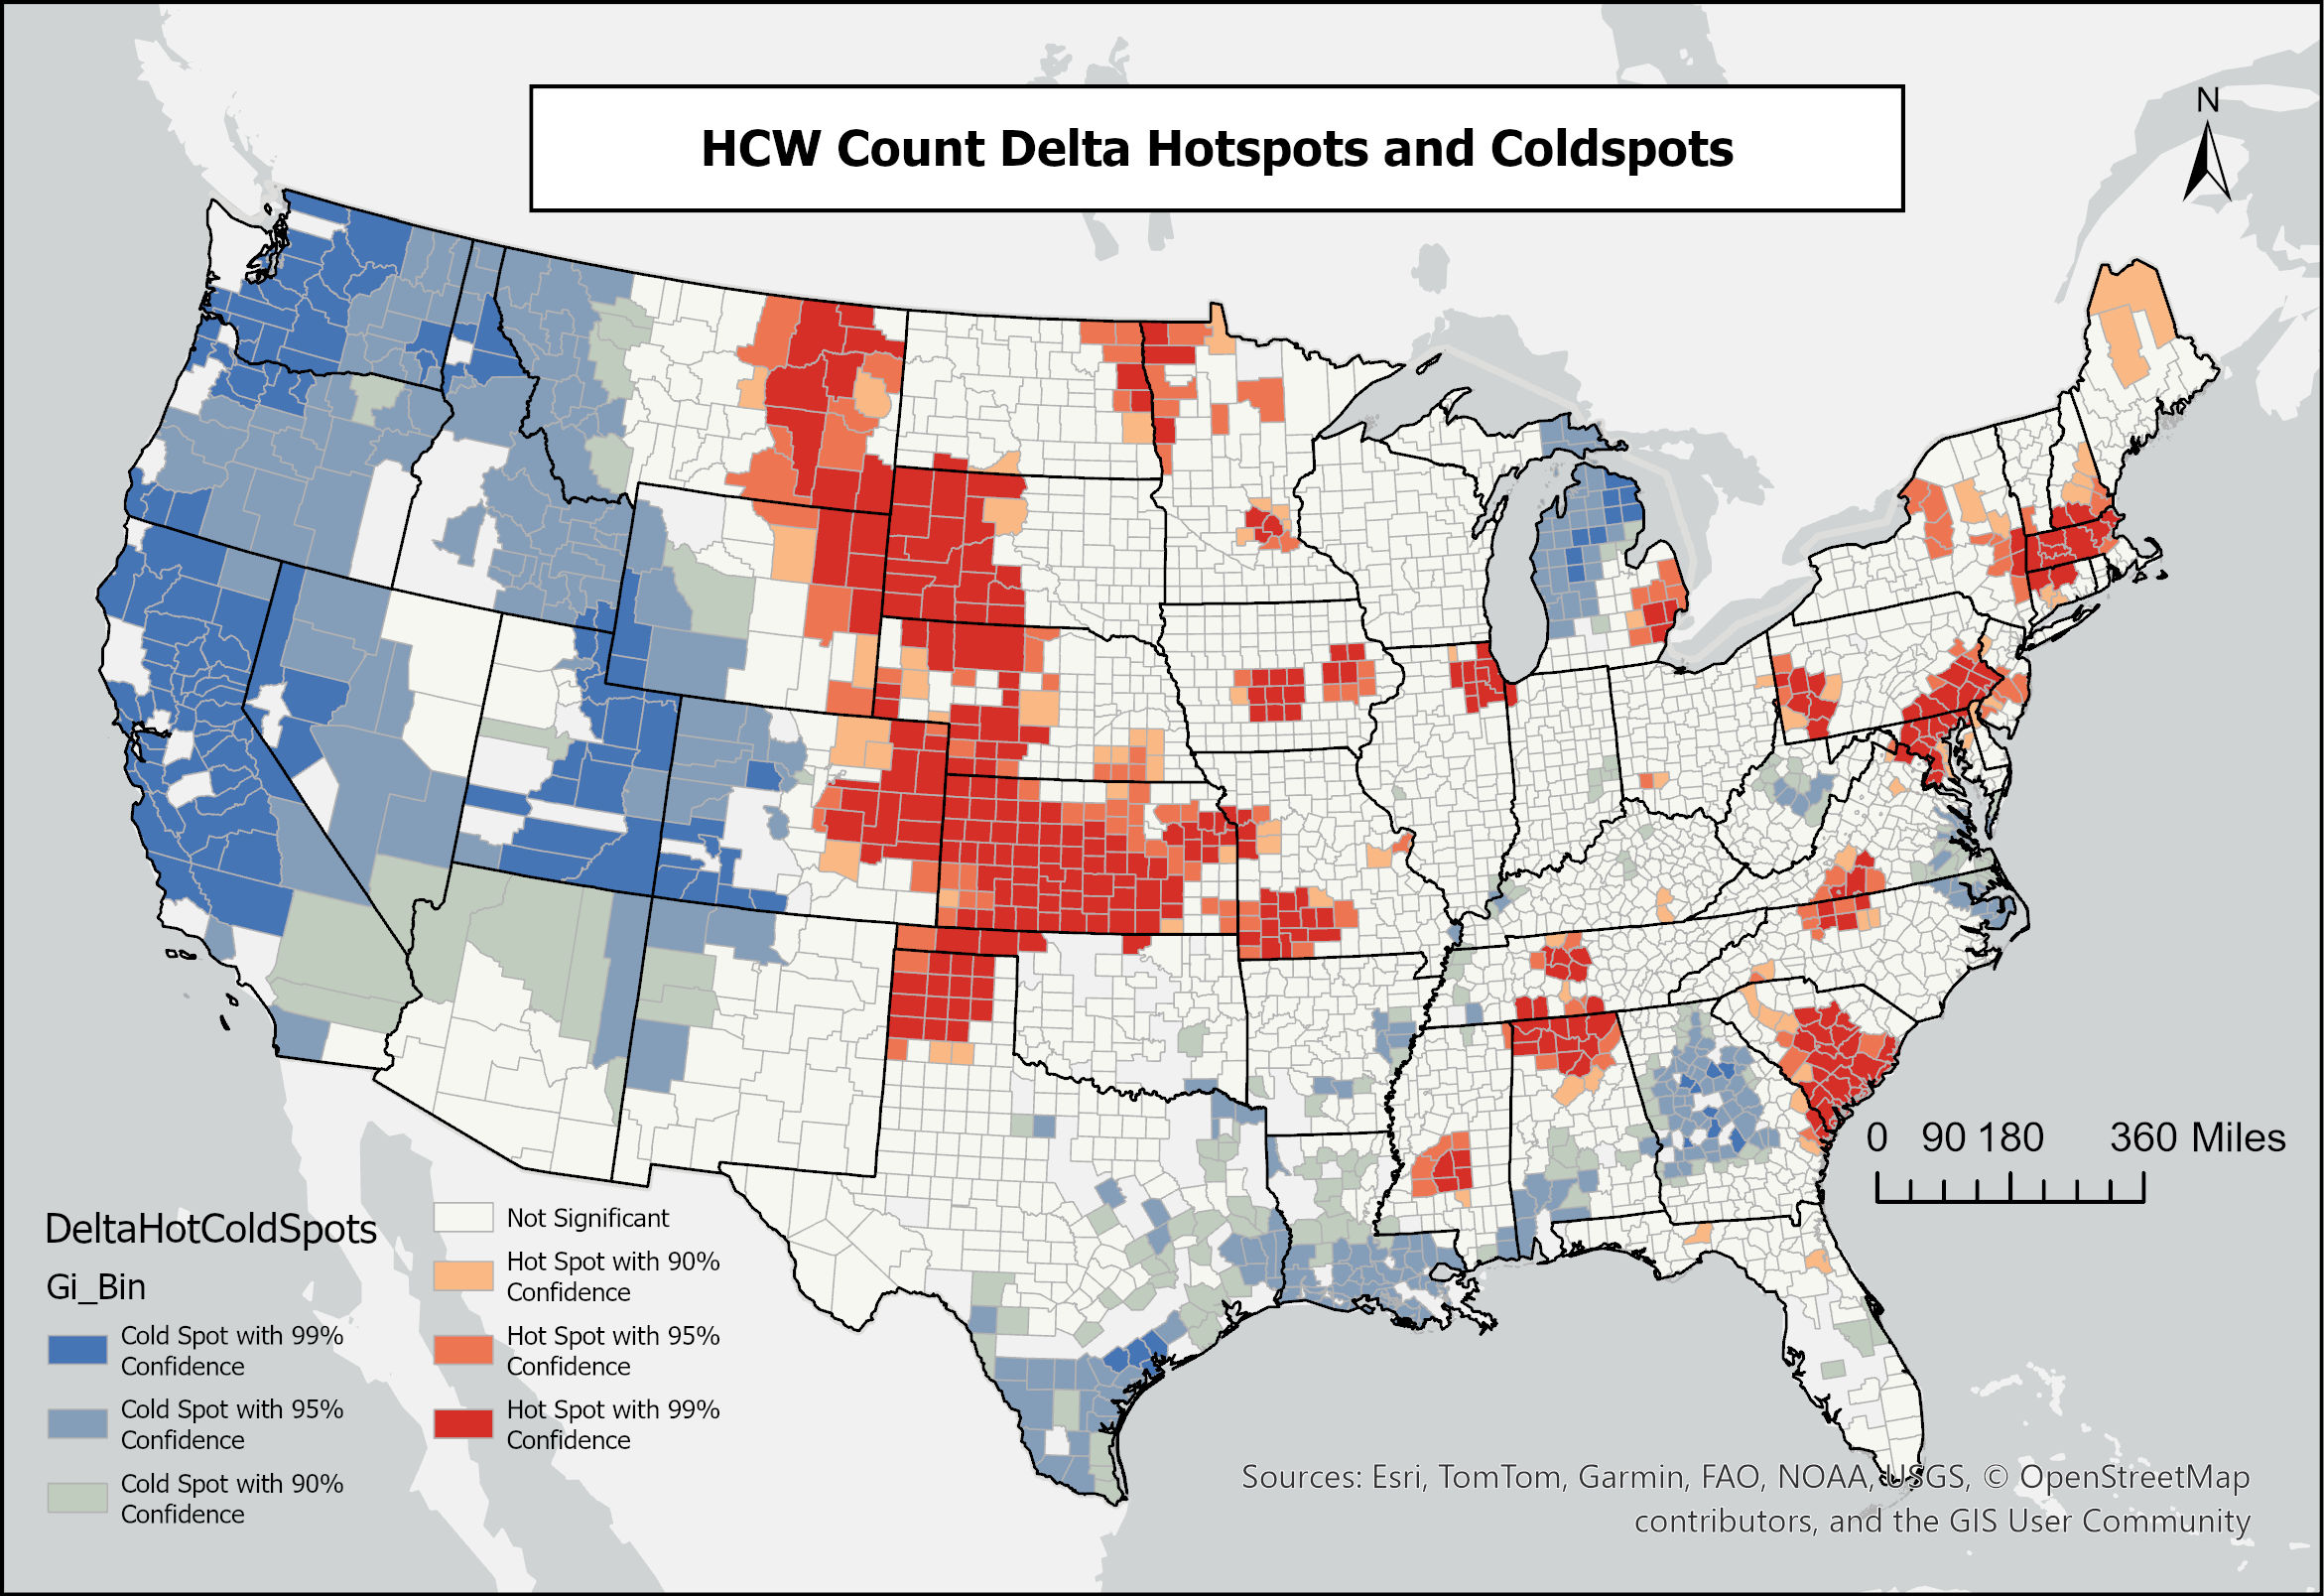
- Hot Spot Analysis: Identified statistically significant clusters of increasing or decreasing peril counts.
Results
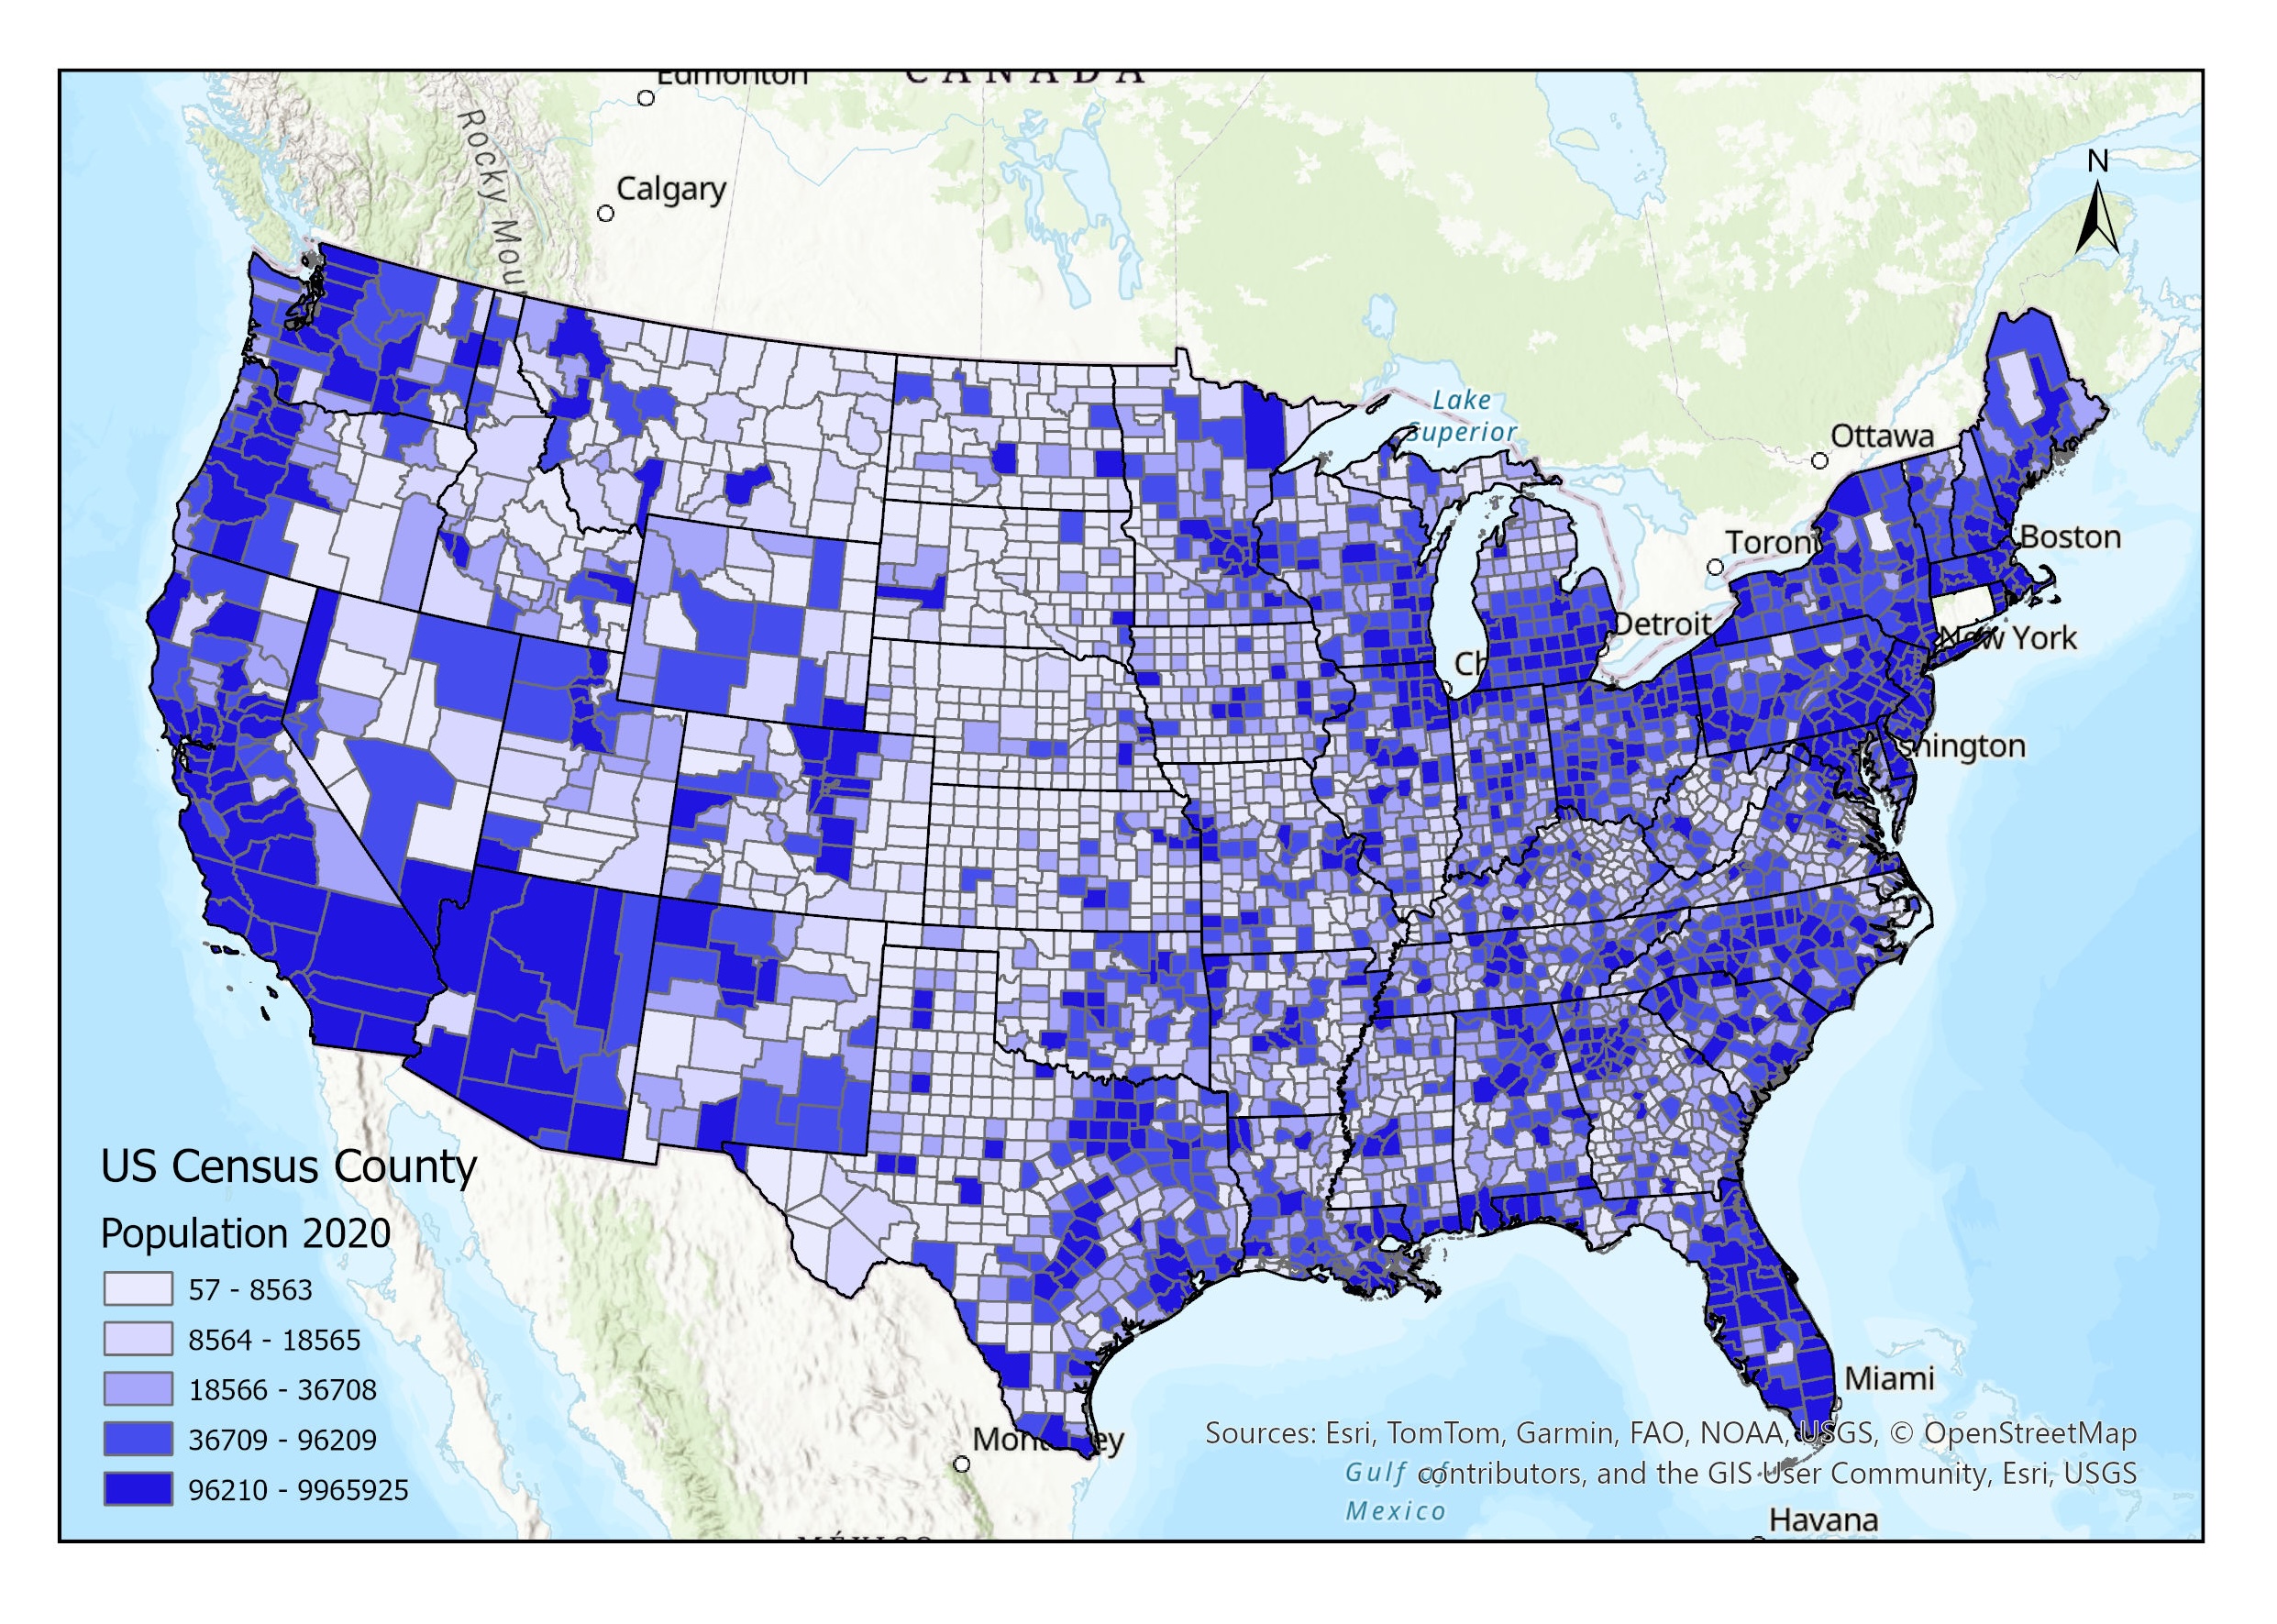
HCW hotspots shifted from the Southern Plains (1980–2000) to the Central/Northern Plains, Midwest, South, and East Coast (2001–2021). Nearly 89% of housing units and mobile homes were located in counties with increasing HCW perils, and over 20% of the U.S. population resided in hotspot counties.
Conclusions
- HCW exposure shifted eastward and intensified between the two study periods.
- Nearly 90% of U.S. housing units and mobile homes are located in counties with increasing HCW peril counts.
- Mobile home residents and socially vulnerable populations face disproportionate exposure in hotspot regions.
- Future work should explore seasonal/diurnal variability and integrate projections of housing growth and climate change.